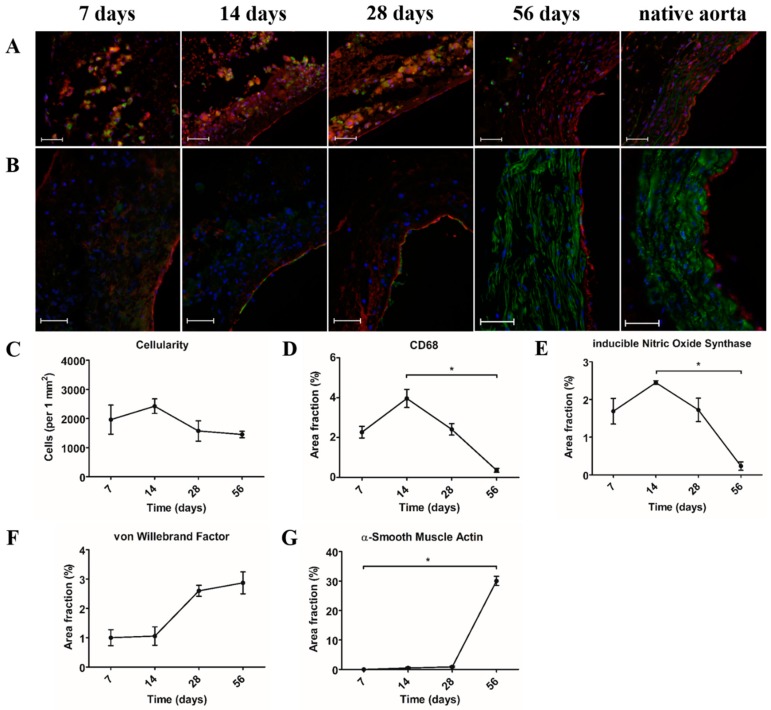
Figure 3.
Cellular infiltration and phenotype. (A) Immunofluorescent co-staining of pan-macrophage marker CD68 (green) and pro-inflammatory macrophage marker anti-inducible Nitric Oxide Synthase (iNOS) (red). Lumen is located at the right side of each picture. Scale bars represent 50 µm; (B) Immunofluorescent co-staining of α-Smooth Muscle Actin (α-SMA) for smooth muscle cells (green) and von Willebrand Factor (vWF) for endothelium (red). Lumen is located at the right side of each picture. Scale bars represent 50 µm; (C) Cellularity in number of cells per square mm; (D) Area fraction in % of CD68; (E) Area fraction in % of iNOS; (F) Area fraction in % of vWF; and, (G) Area fraction in % of α-SMA. (C–G) * p < 0.05.

