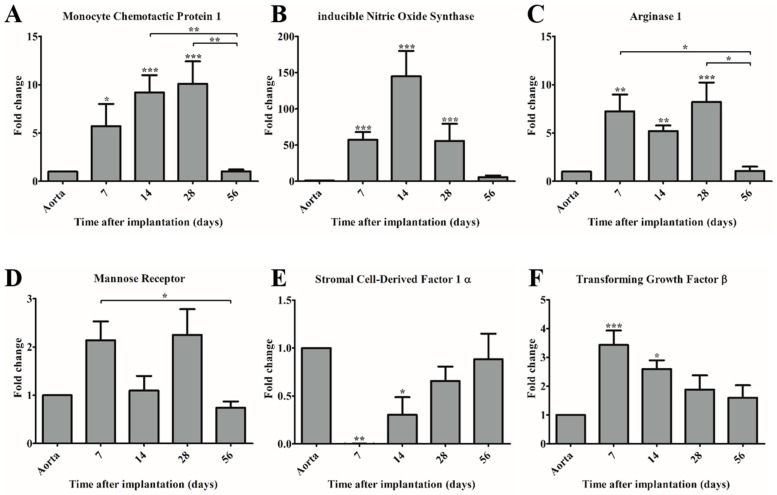
Figure 4.
Gene expression of immunomodulating genes (A,E,F) and macrophage subset markers (B–D) in time compared to control (native aorta). Gene expression of (A) Monocyte Chemotactic Protein-1 (MCP-1); (B) anti-inducible Nitric Oxide Synthase (iNOS); (C) Arginase-1 (Arg-1); (D) Mannose Receptor (MR); (E) Stromal cell-Derived Factor 1α (SDF-1α); and, (F) Transforming Growth Factor-β (TGF-β). * p < 0.05 versus control, ** p < 0.01 versus control, *** p < 0.001 versus control.

