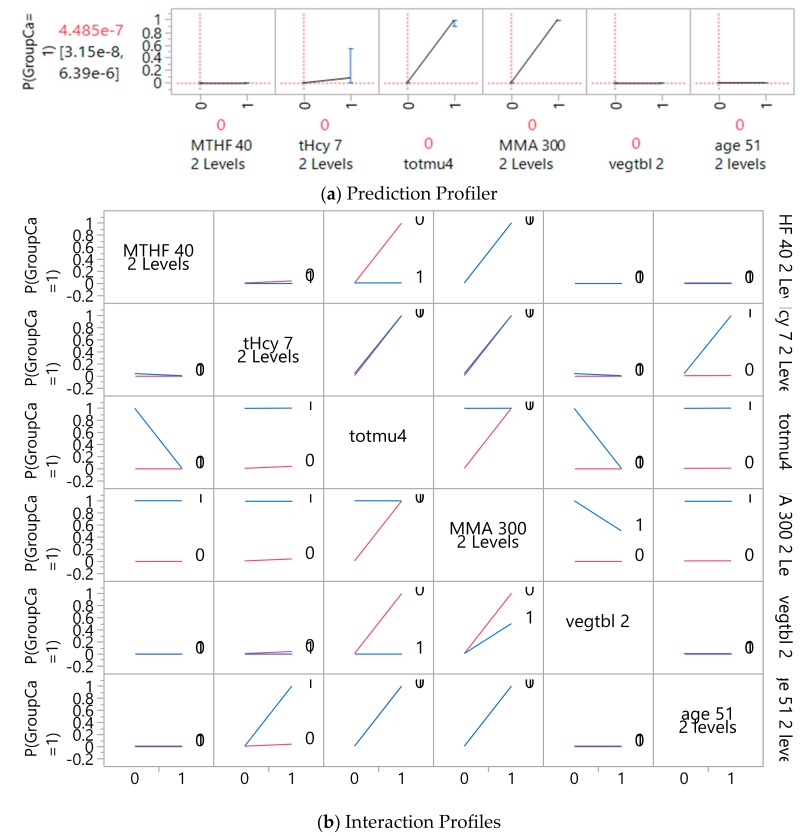
Figure 2.
Prediction profiler (a) for significant predictors of colorectal cancer, and (b) interaction profiles of included parameters. Note. Non-parallel lines denote interactions between parameters in association with probability of cancer status (p (GroupCa = 1)), predictive parameters coded in 2 levels by median values; MTHF 40: Methyl folate level 40 nmol/L; tHCY 7: Total homocysteine 7 µmol/L; totmu4: total gene mutation score ≥4; MMA 300: Methylmalonic acid 300 nmol/L; vegtbl 2: Vegetable intake 2 cups.

