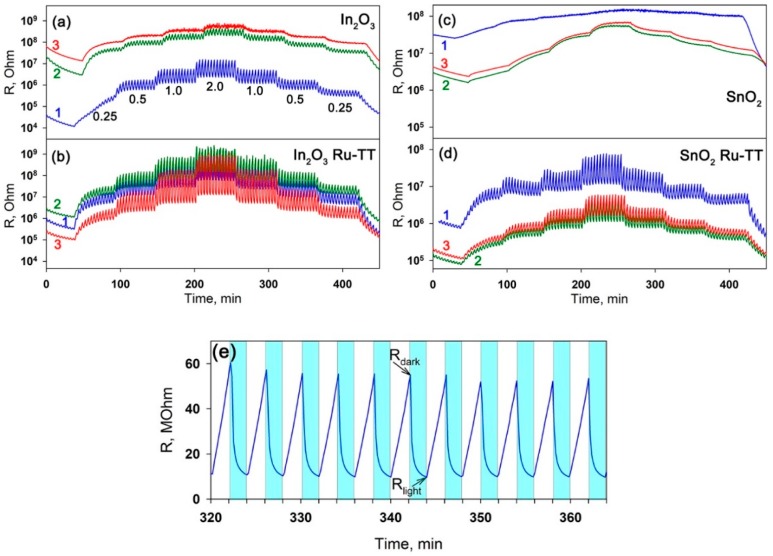
Figure 9.
Room-temperature electrical resistances of (a) In2O3, (b) In2O3 Ru-TT, (c) SnO2, and (d) SnO2 Ru-TT samples under periodic illumination, depending on NO2 content in the gas phase. (1): blue light (λmax = 470 nm), (2): green light (λmax = 535 nm), (3): red light (λmax = 630 nm). The digits on Figure 9a show the sequence of changes in NO2 concentration (ppm). (e) Room-temperature electrical resistance of the In2O3 Ru-TT sample in the presence of the 0.5-ppm NO2 concentration under periodic blue light (λmax = 470 nm) illumination. The shaded areas correspond to the “light on” period.

