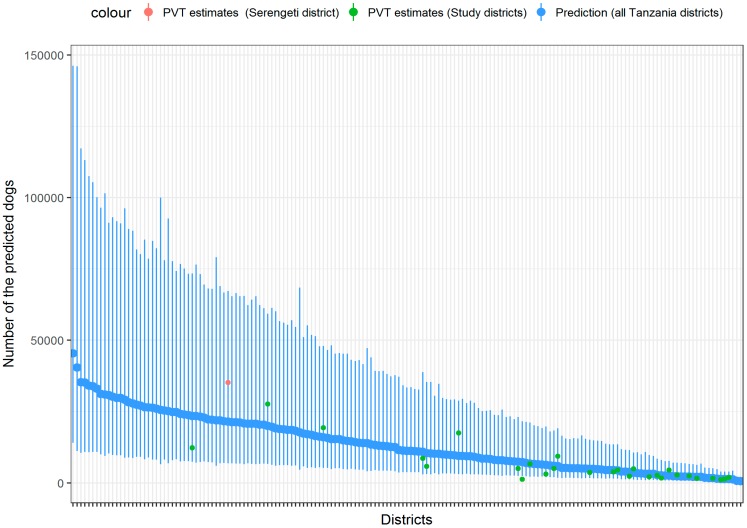
Figure 3.
The predicted number of dogs in districts across Tanzania. The predictions and prediction intervals are shown in blue and compared to the dog population estimated directly from transects for a non-study district (Serengeti, in red) and for the study districts. Most of the green points (27 out of 28) from the model-building set were within the prediction intervals, suggesting that the fit of the model is reasonably good, with no outlier districts for whom the model is making poor predictions. Districts are ordered according to those with the largest (left-hand side) to the smallest predicted dog population (right-hand side). District names are shown in Figure A2. Serengeti transects were conducted in August 2015. PVT = post-vaccination transects.

