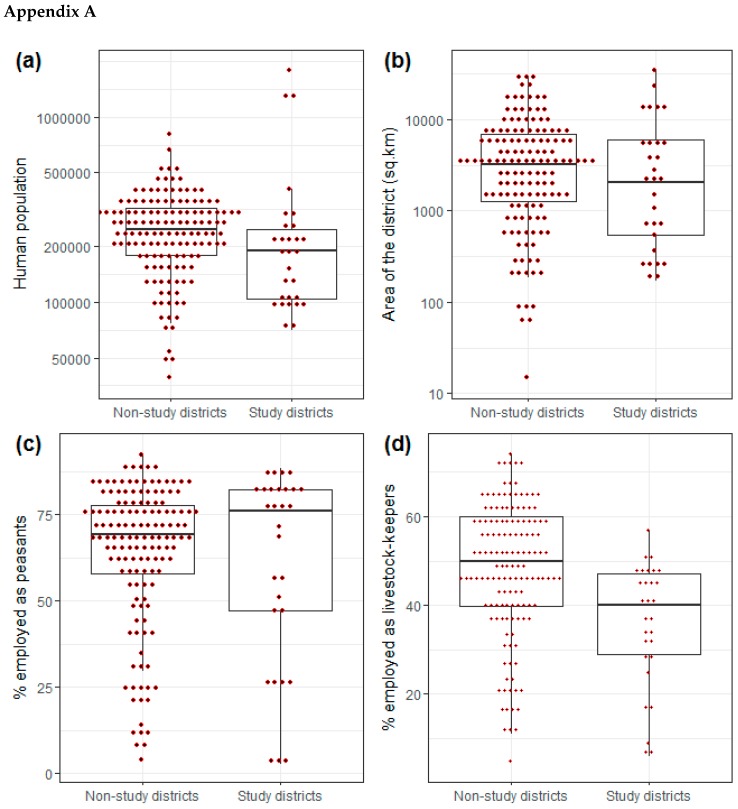
Figure A1.
The distribution of the non-study districts and study districts in Tanzania. Red points represent data from each district. (a) Human population from the National census in 2012; (b) geographical area of the district in square kilometres; (c) percentage of population (aged >10 years and above) employed as peasants; and (d) percentage of population (aged >10 years and above) employed as livestock keepers.

