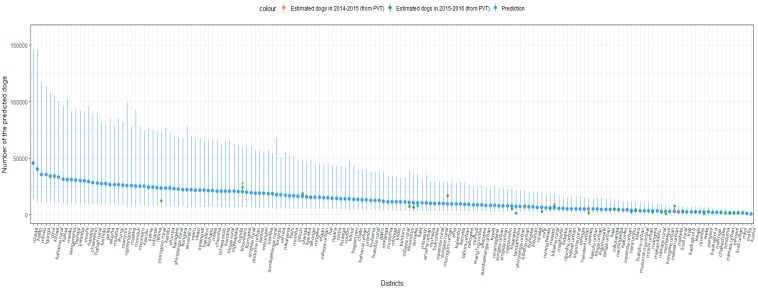
Figure A2.
The predicted number of dogs in districts across Tanzania. Model predictions (points) and their prediction interval are shown in blue and compared to dog populations estimated directly from transects conducted in 2014–2015 (red points) and in 2015–2016 (green points). This comparison shows that there was minimal year-to-year variation in the estimated number of dogs per district.

