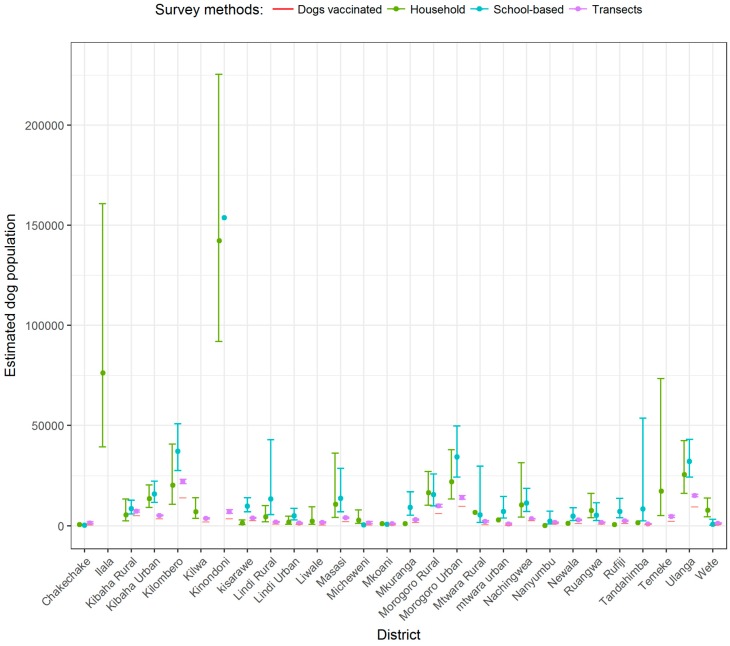
Figure A3.
Dog population size estimates for the 28 districts. Data for the household survey were collected in 2011 (different dog vaccination campaigns), while school-based survey and transects were conducted in 2014 and 2015 following the dog vaccination campaigns. Points are the mean estimate and error bars show the 95% confidence intervals (CIs) around the mean. We did not report CIs for districts where less than three dog-owning households were sampled, or where surveys were not administered.

