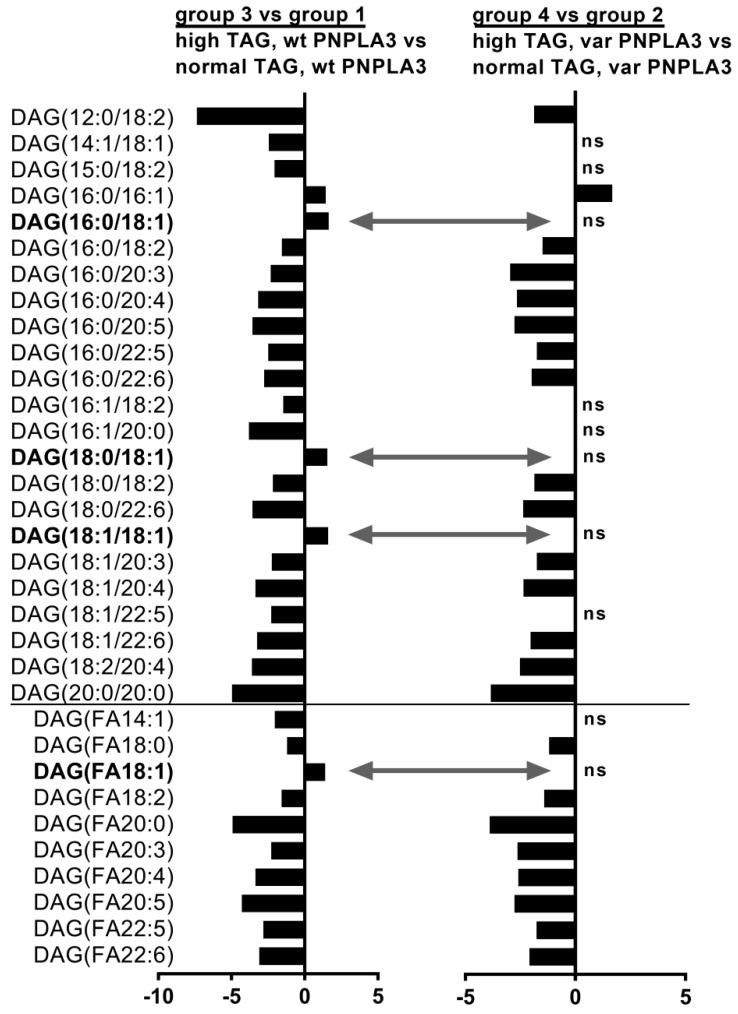
Figure 2.
Individual DAGs and their sums, which are significantly changed due to high vs. normal TAG level in subjects with wild-type PNPLA3 (first diagram) and I148M PNPLA3 carriers (second diagram). Column diagrams depict linear fold changes calculated from the proportion of relative individual lipid species and sums, which were significantly altered due to increased liver TAG content in wild-type carriers (first diagram) or in I148M PNPLA3 carriers (second diagram). Positive ratios denote lipids, which are higher in subjects with high liver TAG content compared to normal TAG group, whereas negative ratios denote lipids, which are lower in subjects with high liver TAG content compared to normal TAG group. For DAGs, both fatty acid chains were determined (see as DAG(XX:X/YY:Y). First numbers denote the length of fatty acid chain and second number after “:” denote the number of double bounds. DAG(FAXX:X) depict the sum of DAGs with the denoted fatty acid chain (FA). Bold lipids depict DAG(FA18:1) lipid species, which are significantly increased in wild-type PNPLA3 carriers, but remained unchanged in I148M PNPLA3 carriers. TAG: liver triacylglycerol content; wt: wild-type allele with I148I; var: I148M variants, which encode I148M (heterozygous) or M148M (homozygous) variants, respectively. ns: non-significant differences.

