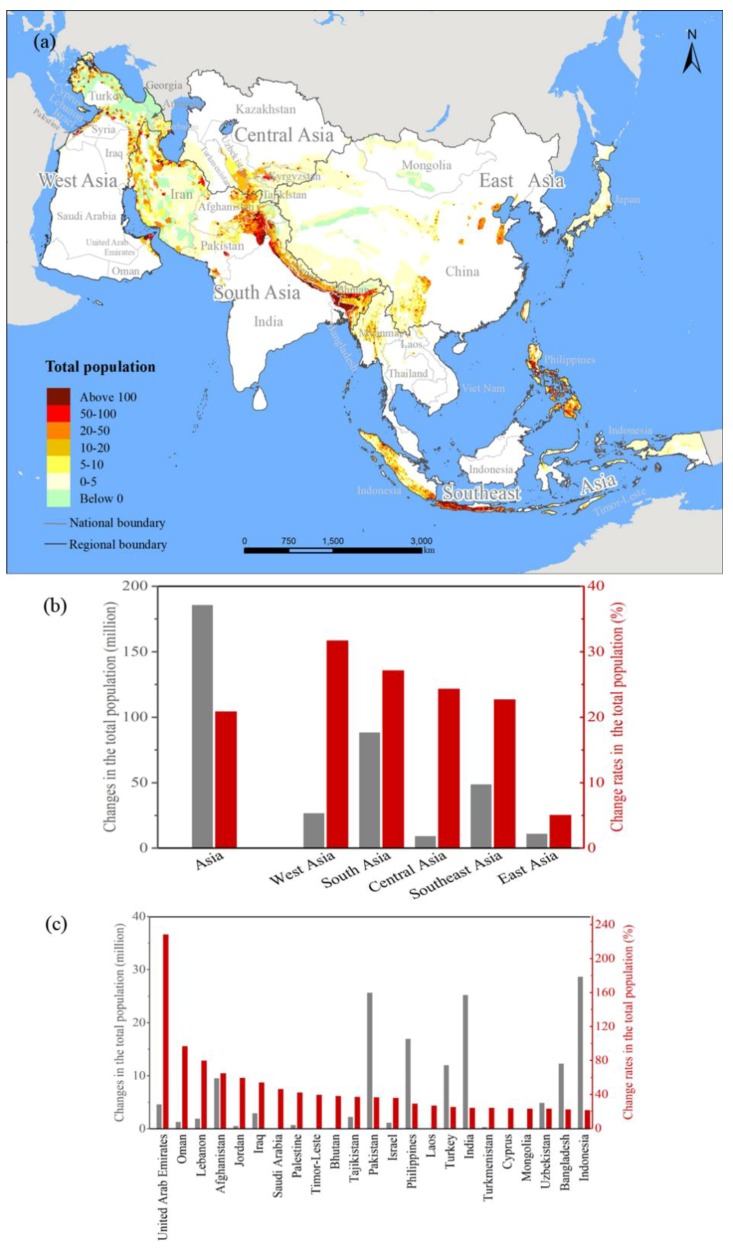
Figure 3.
Changes in the total populations living among different MSHA from 2000 to 2015. (a) The total population density, unit: people/km2; (b) The change rates in the total population in the MSHA of Asia; (c) The change rates in the total populations living in the MSHA of the selected countries. (The countries were selected when the total population in an MSHA increased from 2000 to 2015).

