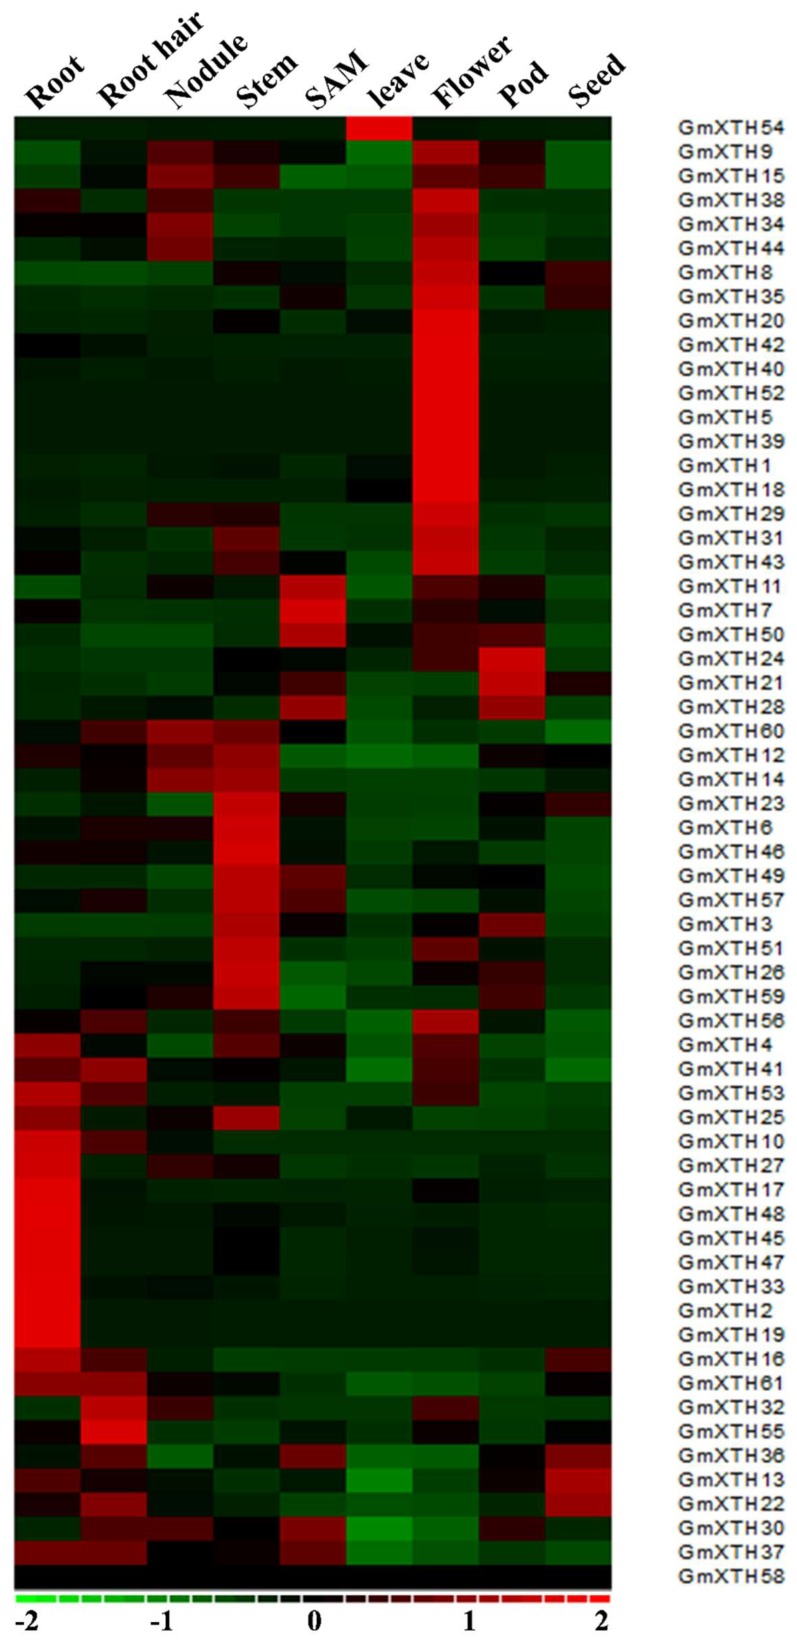
Figure 4.
Heatmap of the expression profiles of the GmXTH gene family in nine organs. Relative organ expression levels of GmXTHs based on RNA-seq data were used to construct the heatmap. The expression values (Reads Per Kilobase Million) were median-cantered and normalized for each gene in different tissues before transforming to color scale. The color bar at the bottom shows the range of expression values from highest expression level (red) to lowest expression level (green), and 0 is the median expression level (Black). SAM (Shoot Apical Meristem).

