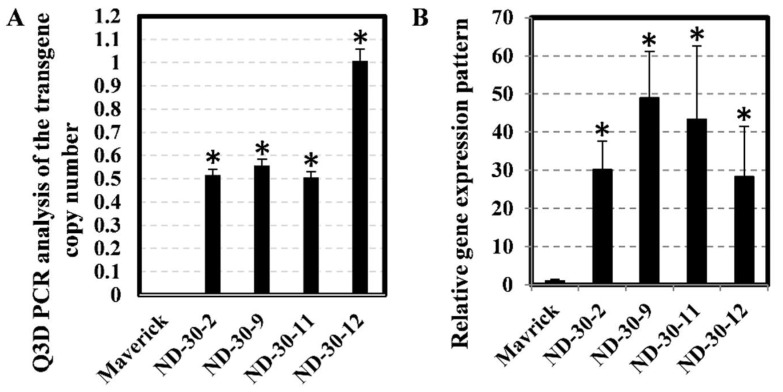
Figure 6.
Calculation of transgene AtXTH31 copy numbers and relative expression levels in four transgenic events. (A) Ratios of copy number between AtXTH31 and lectin gene (Glyma.02G009600) were determined by digital PCR in soybean T0 transgenic generation. Soybean transgenic plants contained a single insert copy when the ratio value was equal to 0.5 and two insert copies when the ratio value was equal to 1. (B) The relative expression of AtXTH31 in T3 homozygous transgenic soybean roots determined by qRT-PCR. The relative levels of transcripts were normalized to the soybean actin gene (Glyma.18G290800). Bars represent mean values of three biological replicates (standard error). * indicates significantly different at p < 0.05 as tested by Fisher’s least significant difference. Non-transgenic Maverick soybean as a control and MYB2:AtXTH31 transgenic soybean lines ND-30-2, ND-30-9, ND-30-11, and ND-30-12 with overexpression of AtXTH31 were studied.

