Figure 5.
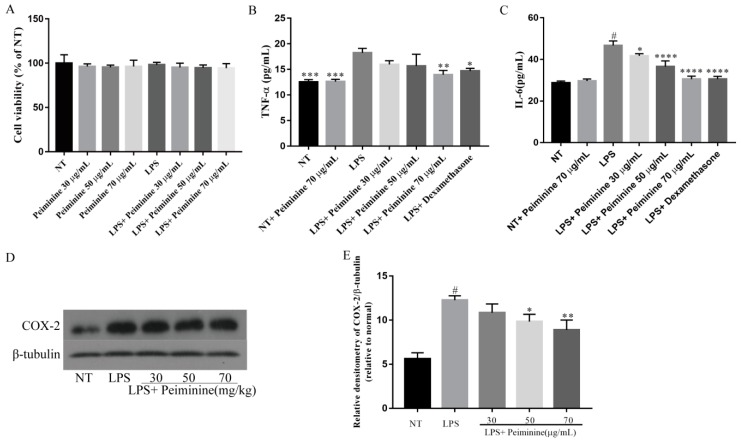
Effect of peiminine on (A) cell viability. The cells were cultured with different concentrations of peiminine (30, 50, or 70 μg/mL) for 4 h. Cell viability was determined by the CCK8 assay. The levels of (B) TNF-α and (C) IL-6 in the mouse mammary epithelial cells (mMECs), including the NT group, the NT + peiminine 70 μg/mL group, the LPS group, and the groups treated with peiminine (30, 50, or 70 μg/mL), and the protein level of (D,E) COX-2 were measured by western blotting. The data are presented as the mean ± SD (n = 6). The number sign (#) indicates a significant difference from the NT group at p < 0.0001. The tetrad asterisks (****) indicate p < 0.0001, the triple asterisks (***) indicate p < 0.0005, the double asterisks (**) indicate p < 0.01, and the single asterisk (*) indicates p < 0.05 vs. the LPS group.

