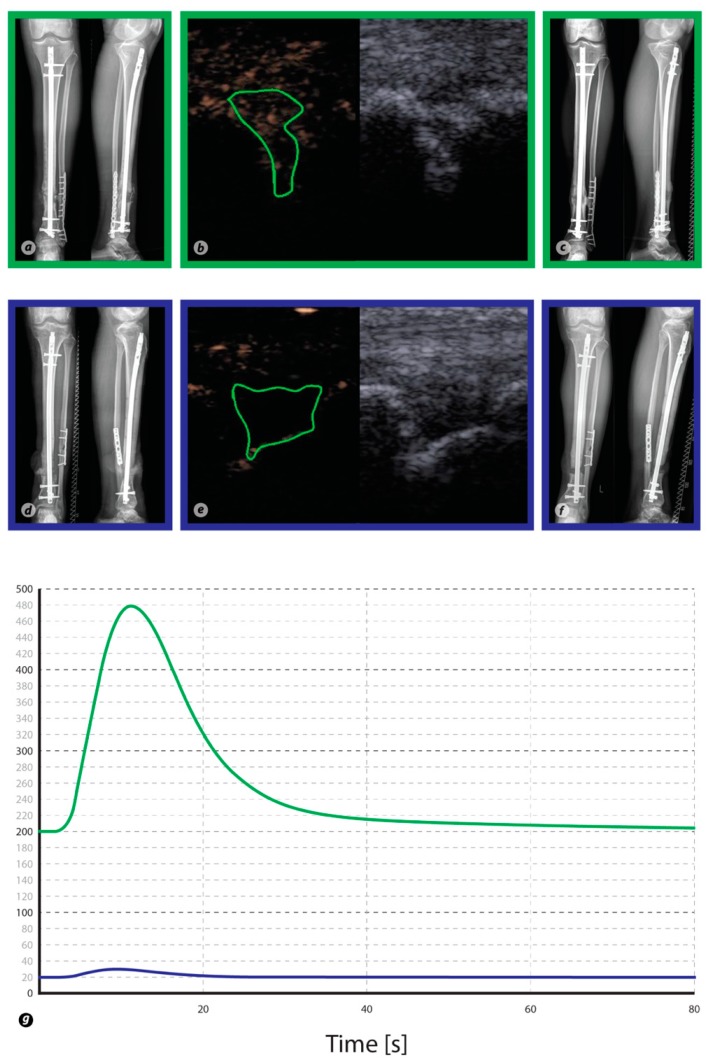
Figure 2.
Conventional X-rays of the tibia and fibula as well as ultrasound images are shown for two patients. In particular, images in green rectangles derive from a Responder to the therapy, whereas images in blue rectangles derive from a Non-Responder. Panel (a,d) was taken prior to treatment, whereas (c,f) was taken 6 months after treatment and illustrates the respective outcome of therapy. Contrast-enhanced ultrasound images before (right side) and after contrast enhancement (left side) for each patient (b,e). The region of interest (irregular green shape) is placed into the non-union gap, and a time–intensity curve is generated by the VueBox quantification software (g). The time–intensity curve of the healing non-union exhibits stronger contrast enhancement than in persistent non-union.

