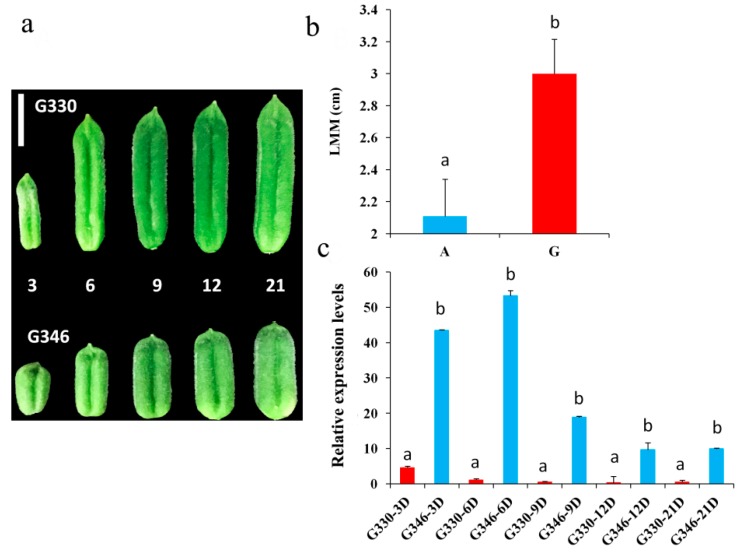
Figure 8.
Expression analysis of the candidate gene for LMM trait between two contrasting accessions. (a) Phenotypes of G330 and G346 displaying long and short capsule length, respectively, at 3, 6, 9, 12 and 21 days after pollination. (b) Identification of the favorable allele at the locus 15,219,964 bp on the LG11. A total of 427 genotypes harboring the A allele and 175 harboring the G allele were used. (c) qRT-PCR relative expression level of the gene SIN_1010995 between G330 and G346 at different days after pollination. Different letters above bars represent significant difference (p < 0.05) between genotypes. The error bar indicates the standard error of the mean. The sesame Actin gene (SIN_1006268) was used as the internal reference and 3 biological replicates and 3 technical replicates were used.

