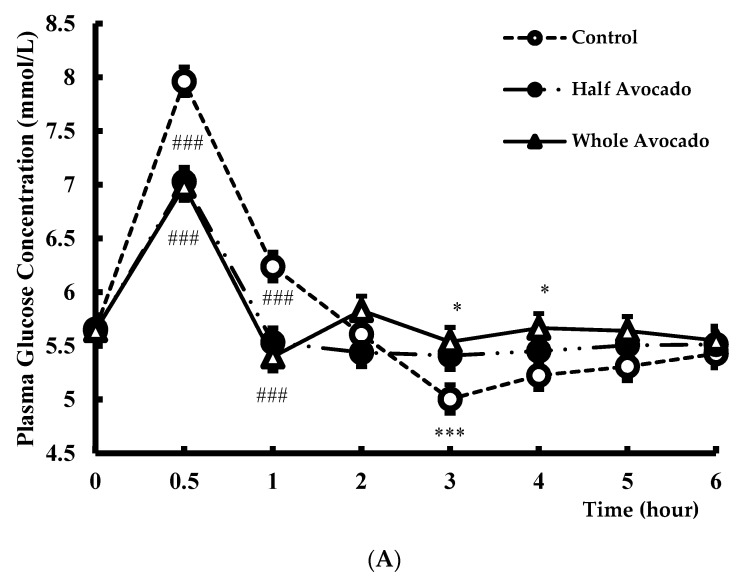
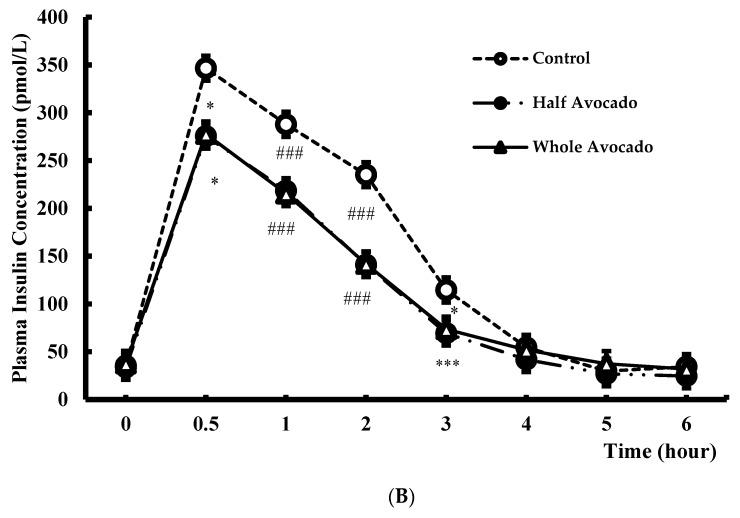
Figure 3.
(A) Plasma glucose response over 6 hours after consuming test meal. The figure legend indicates test meal groups (n = 31). Data were analyzed by PROC MIXED using SAS 9.4. Main effects of meal p = 0.07, time p < 0.0001, and meal by time p < 0.0001. Data are means ± SE, n = 31. * p < 0.05, *** p < 0.005, ### p < 0.0001 for the difference compared to Control; (B) Plasma Insulin response over 6 h after consuming test meal. The figure legend indicates test meal groups (n = 31). Data were analyzed by PROC MIXED using SAS 9.4. Main effects of meal p < 0.0001, time p < 0.0001, and meal by time p < 0.0001. Data are means ± SE, n = 31. * p < 0.05, *** p < 0.005, ### p < 0.0001 for the difference compared to Control.


