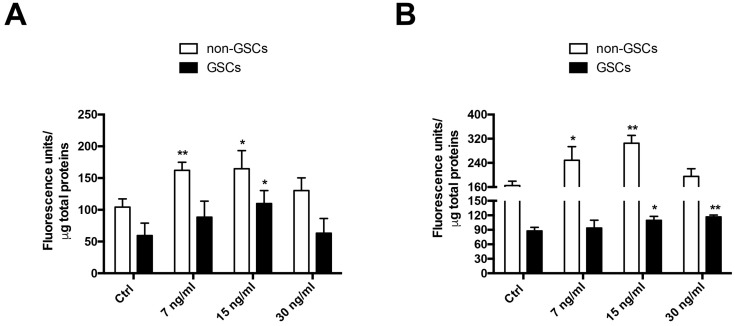
Figure 2.
Effect of FK506 on MRP1 activity in U87MG and C6 cells. Cells were treated with FK506 (7, 15, and 30 ng/mL) for 24 h. Activity was measured by MRP1 fluorescent substrate Carboxyfluorescein Diacetate (CFDA) accumulation. The graphs represent fluorescence units normalized by protein concentration in U87MG (A) and C6 (B) cells. White bars represent non-GSCs and black bars represent GSCs. Graphs represent the mean ± S.D. * p < 0.05 and ** p < 0.01 versus the control condition (Ctrl). n = 6.

