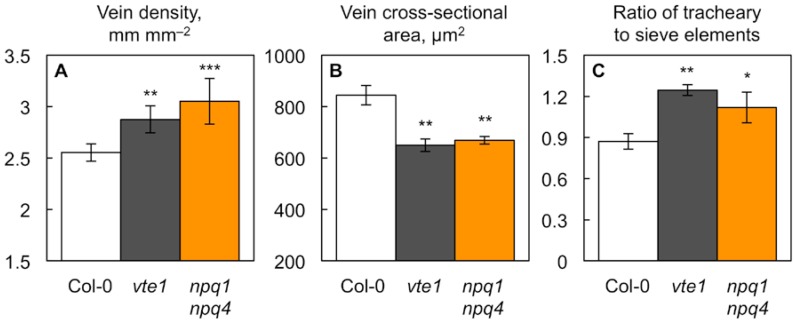
Figure 2.
(A) Minor vein density (vein length per leaf area), (B) minor vein cross-sectional area, and (C) the ratio of the number of water-transporting tracheary to sugar-exporting sieve elements in the leaves of wild-type Col-0 (open columns) and the vte1 (dark gray columns) and npq1 npq4 (orange columns) mutants of Arabidopsis thaliana grown at 35 °C. Mean values ± standard deviations for (A) and ± standard errors for (B,C) (n = 3 or 4). Significant differences (Student’s t-test) between Col-0 and the mutants are indicated by asterisks; * = p < 0.05, ** = p < 0.01, *** = p < 0.001.

