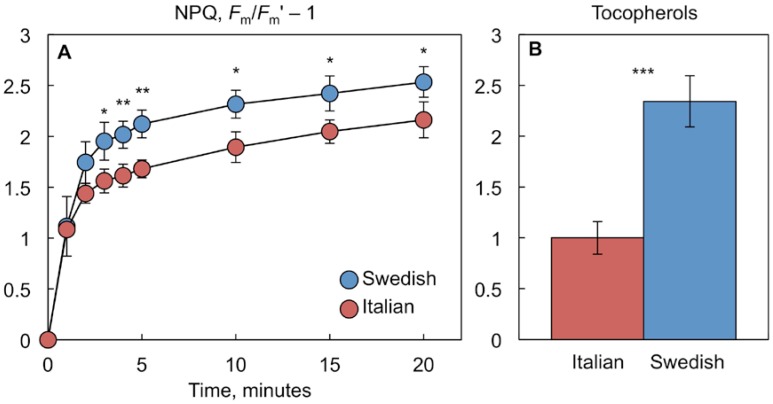
Figure 4.
(A) Time course of the development of the non-photochemical quenching of chlorophyll fluorescence (NPQ) under 2% O2 (balance N2) and 2000 µmol photons m−2 s−1 at 25 °C and (B) tocopherol content for leaves of Italian (red symbols) and Swedish (blue symbols) ecotypes of Arabidopsis thaliana grown at 35 °C. Tocopherols are recalculated from data in Stewart et al. [8] and expressed as relative values (with the mean value for the Italian ecotype set to 1). Mean values ± standard deviations (n = 3 or 4). Significant differences (Student’s t-test) between the ecotypes are indicated by asterisks; * = p < 0.05, ** = p < 0.01, *** = p < 0.001.

