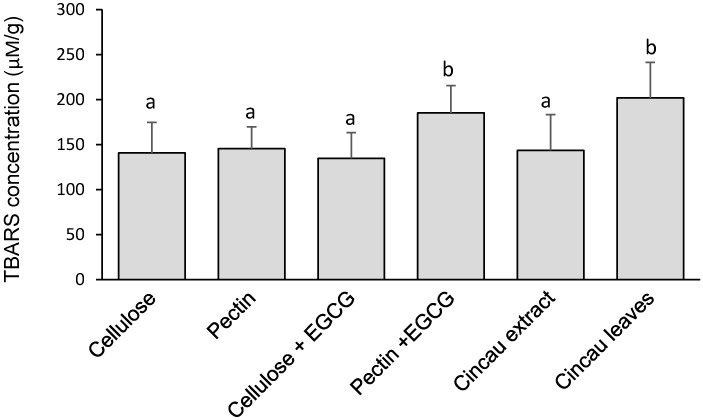
Figure 3.
Effects of different diets on thiobarbituric acid reactive substance (TBARS) concentration in the livers of rats six weeks after the second AOM injection (2 × 15 mg/kg). Values are the mean ± SE (n = 10). Means with a different letters on the bar are statistically significantly different (p ≤ 0.05). EGCG, 0.1% epigallocatechin-3-gallate.

