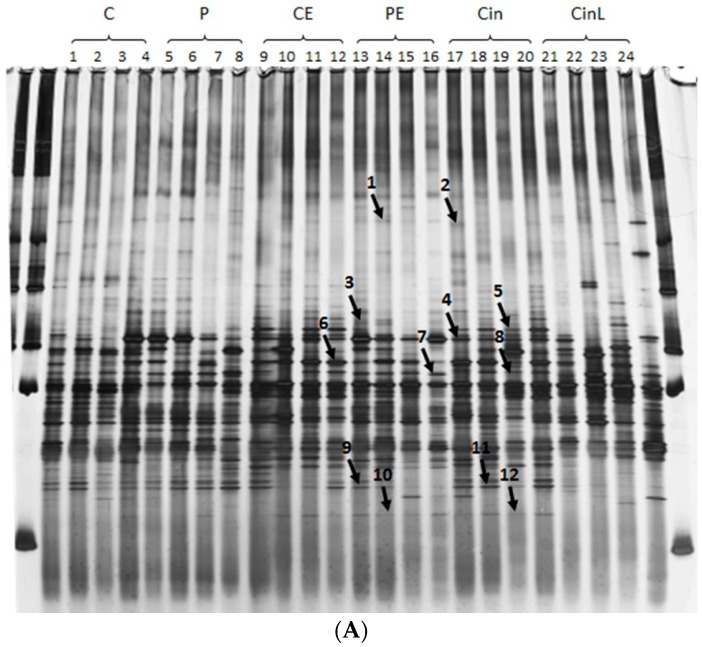
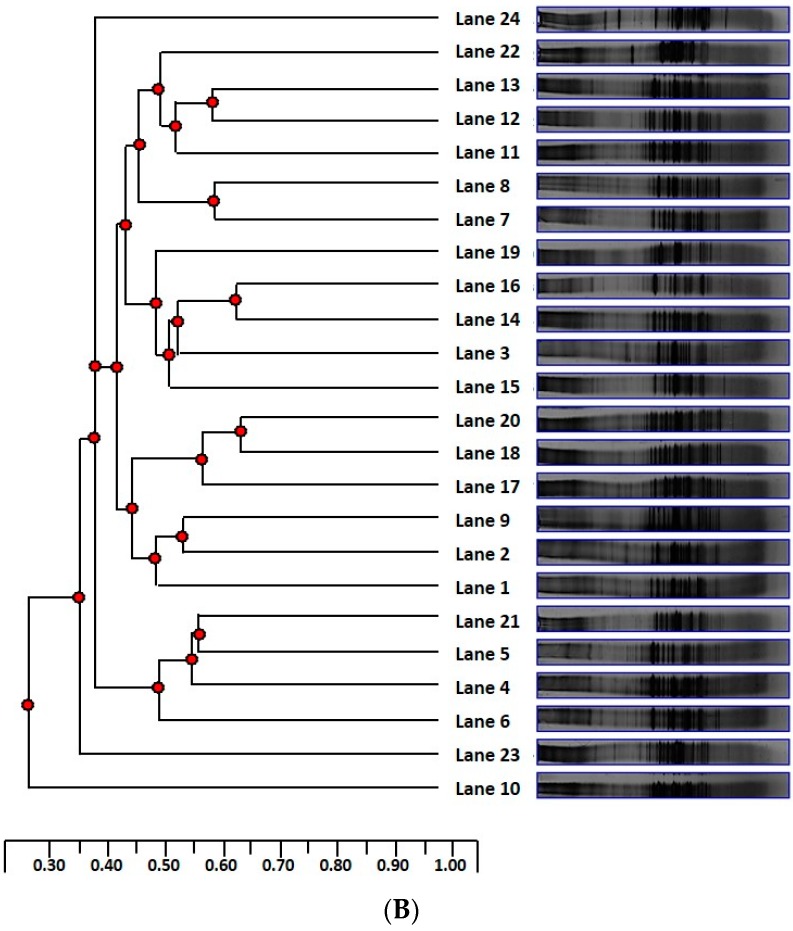
Figure 4.
Denaturing gradient gel electrophoresis (DGGE) analysis (A) and unweighted pair groups with mathematical averages (UPGMA) dendrogram (B) of 16S rRNA gene fragments representing the bacterial population amplified from DNA extracted from digesta from rats six weeks after the second AOM injection (2 × 15 mg/kg). (A) Bands of interest are indicated by arrows and numbered 1 to 12. Bands 1 to 7 were cut out for DNA extraction and sequencing. (B) Scale refers to similarity index Lane 1–4: C = cellulose; Lane 5–8: P = pectin; Lane 9–12: CE = cellulose + EGCG; Lane 13–16: PE = pectin + EGCG; Lane 17–20: Cin = cincau extract; Lane 21–24: CinL = Cincau leaves. EGCG, 0.1% epigallocatechin-3-gallate.


