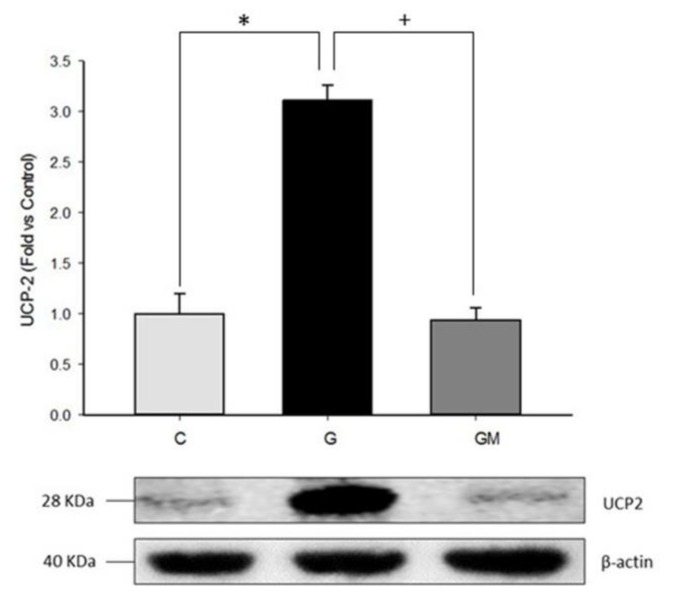
Figure 3.
UCP2 protein levels in HepG2 cells treated with glucose 25 mM (G) and M. oleifera extract 500 µg/mL (GM). Cells without treatment represent control condition (C). * significant difference against control p ≤ 0.05. + significant difference against G cells p ≤ 0.05. Data normalized to control group using β-actin.

