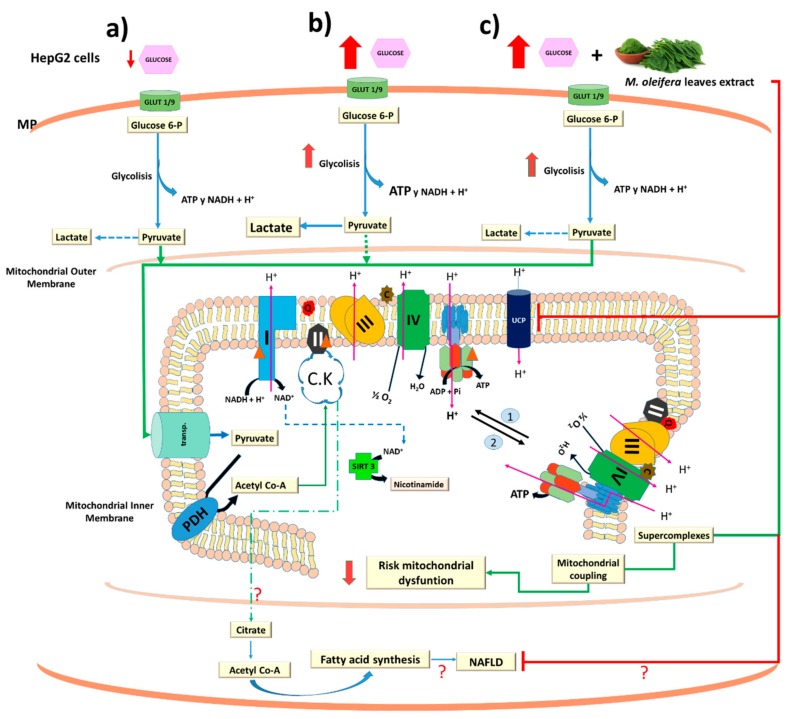
Figure 7.
Proposed model for uncoupling protein 2-acetylation by sirtuins signaling pathway on HepG2 treated with high glucose and M. oleifera extract. The solid lines indicate carbon skeletal main flux to mitochondria (a). While that punted lines indicates the secondary pathways. PDH, pyruvate dehydrogenase; CK, Krebs cycle. The numbers 1 and 2 indicates the dissociation and association of the mitochondrial supercomplexes. Red and green lines indicate inhibition and activation of metabolic process by high glucose (b) and M. oleifera extract (c), respectively. Glut 1 and Glut 9 as major contributors to glucose influx in HepG2 cells [87]. MP, plasma membrane. Red triangle indicates potential site of acetylation in mitochondrial complexes.

