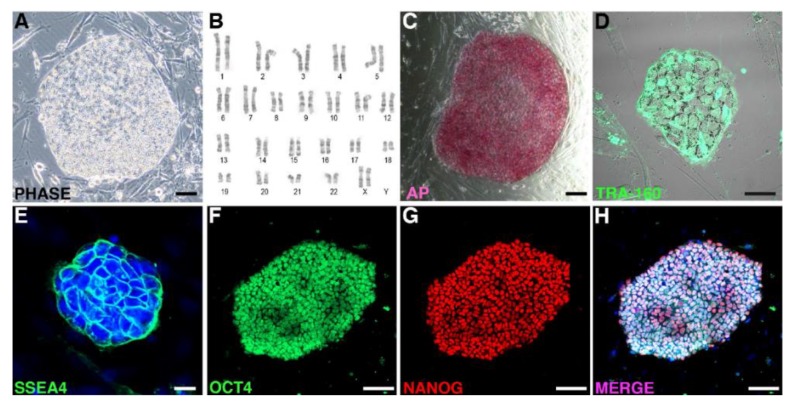
Figure 2.
Characterization of the NHP-iPSC lines. (A) Example of the marmoset iPSC colony derived by reprograming skin fibroblast using the episomal approach showing a normal karyotype at passage 16 (B). The iPSC colonies express pluripotent markers, including alkaline phosphatase (C), TRA-160 (D), SSEA4 (E), OCT-4 (F), and NANOG (G). Scale bars: 100 μm in (A,C,F–H); 50 μm in (D); and 20 μm in (E).

