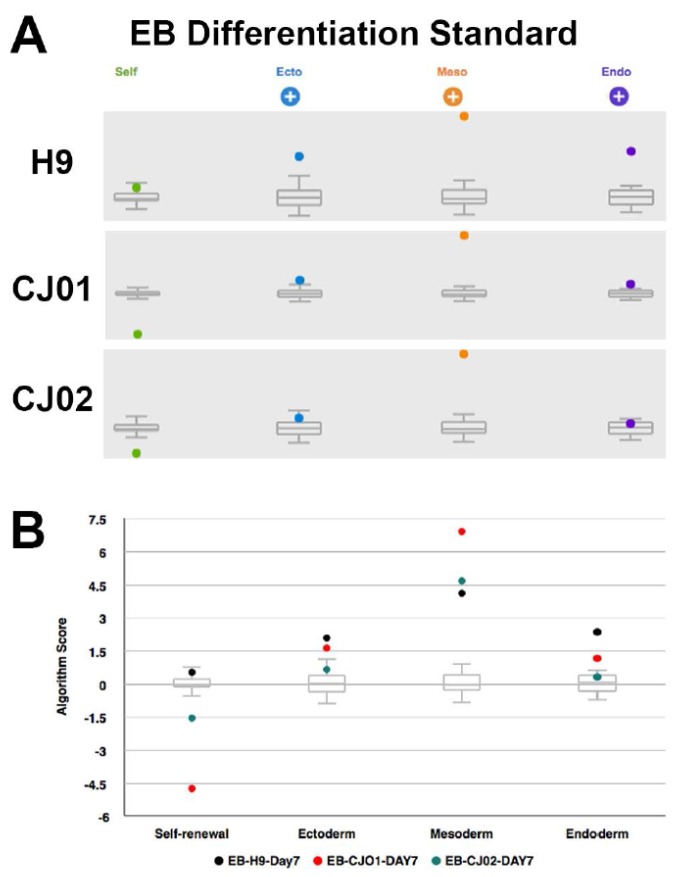
Figure 5.
Score box plot from scorecard analysis for differentiation potential. (A) Scorecard results of H9, CJ01, and CJ02 iPSC differentiation tendency to the undifferentiated reference set. The samples were seven-day old embryoid bodies (EBs). The EBs downregulated pluripotent genes (green) as shown with the negative (−) sign for CJ01 and CJ02 and significantly upregulated EC, ME, and ED as shown with the (+) sign. (B) Score box plot represents comparison of all samples. Black, red, and green dots indicate seven-day old EBs from H9, CJ01, and CJ02, respectively. The range of scores for the undifferentiated reference set is indicated by the gray box score on the 0 score line.

