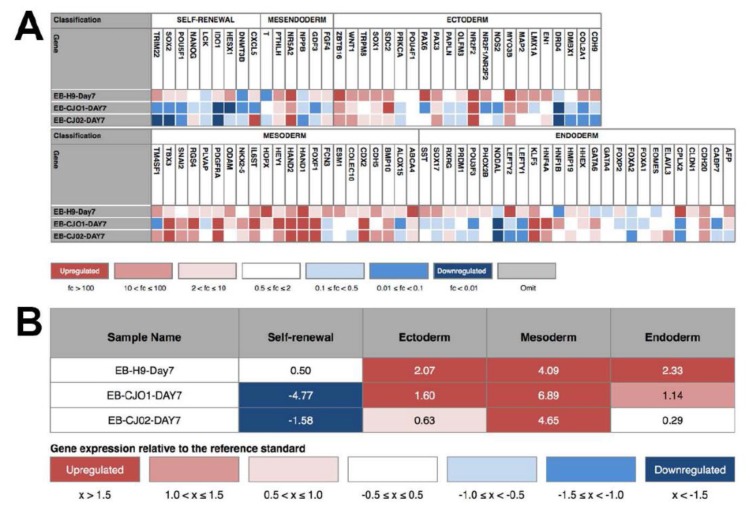
Figure 6.
Heat map and score table from scorecard analysis for differentiation potential. (A) Heat map of expression of self-renewal and three germ layer markers by the seven-day old EBs differentiated from the H9, CJ01, and CJ02; (B) Score table showing scores derived from statistical comparison of the sample expression profile to that of the undifferentiated reference set. Colors correlate to the fold change in expression of the indicated gene relative to the undifferentiated reference set.

