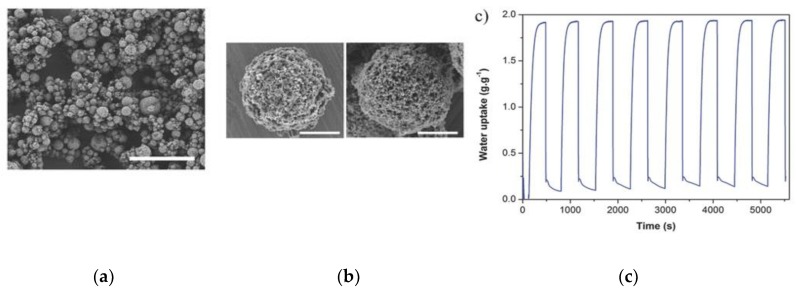
Figure 12.
(a) Representative FESEM image of microspherical CaCl2@UiO-66, (b) FESEM images of microspherical CaCl2@UiO-66_38 superstructures before (left) and after (right) incubation in ethanol, (c) adsorption and desorption cycles for CaCl2@UiO-66_38. Scale bars: (a) 20 μm, (b) 3 μm. Reproduced with permission from [89]. Wiley, 2016.

