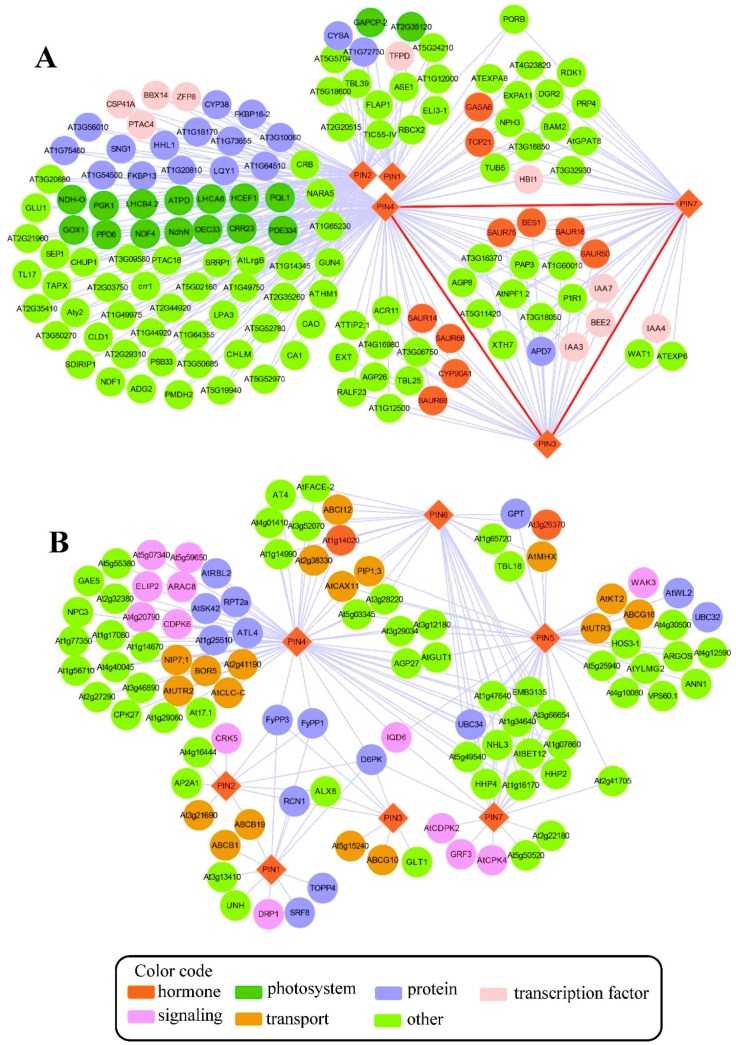
Figure 2.
(A) The co-expression network of PIN genes and (B) the PIN protein interaction network in Arabidopsis. The network was constructed using an online database, CressExpress (available online: http://cressexpress.org/home.xhtml). This was done using pathway-level co-expression (PLC) analysis as suggested by Wei et al. [71] and visualized in Cytoscape (3.5.0) [86]. In the co-expression network, the lines between nodes represent significant correlations between two genes. The red lines represent significant correlations between PIN genes. The protein-protein interaction network was constructed using Cytoscape with data from the BioGRID database [87] (available online: https://thebiogrid.org/). In the PIN protein interaction network, the lines between nodes represent physical interactions verified by experimental approaches (for detail, see Table S1). The PIN genes/PIN proteins are represented by diamonds, and other co-expressed genes/interactive proteins are represented by circles. The different colors indicate different functional categories assigned by Mapman software [88], as shown by color codes.

