Figure 1.
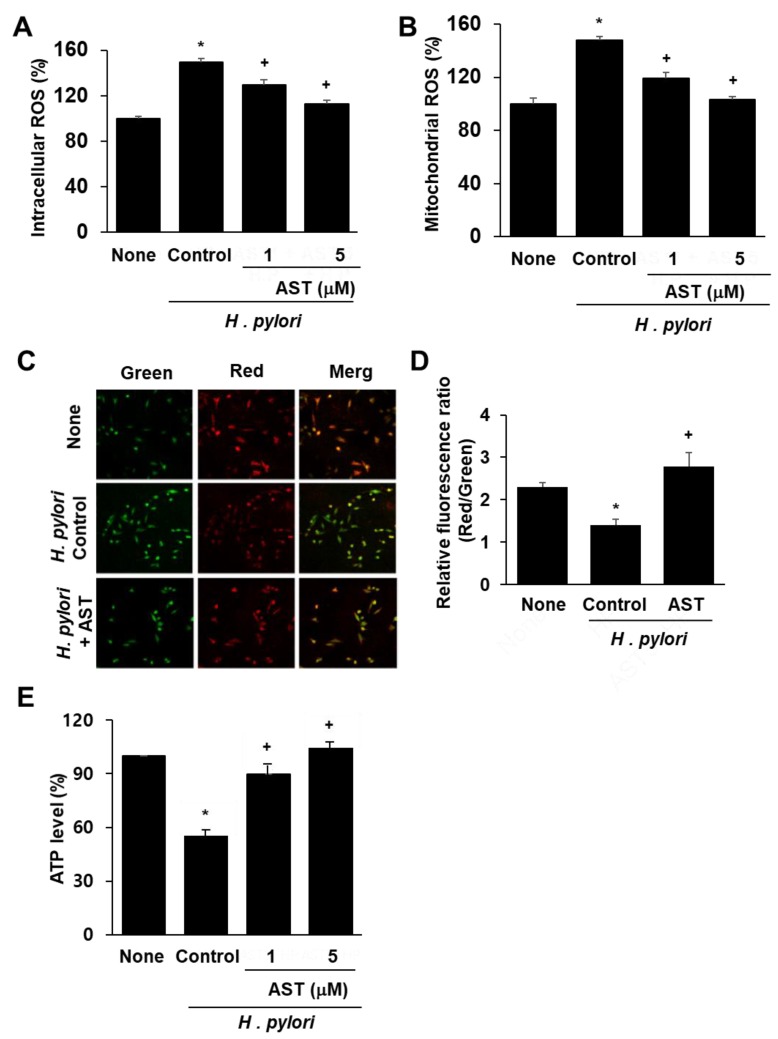
Effect of astaxanthin on ROS levels and mitochondrial dysfunction in H. pylori-infected AGS cells. The cells were pre-treated with the indicated concentrations of astaxanthin for 3 h and then stimulated with H. pylori for 1 h. (A) Intracellular ROS levels measured by DCF-DA fluorescence for uninfected AGS cells (None), AGS cells infected with H. pylori (Control; * p < 0.05 vs. None), AGS cells infected with H. pylori and treated with 1 or 5 μM astaxanthin (AST; + p < 0.05 vs. Control). (B) Mitochondrial ROS levels were measured by MitoSOX fluorescence and reported the same as in (A). (C) MMP of AGS cells without infection (None), infected with H. pylori alone (Control) or with H. pylori infection plus treatment of 5 μM astaxanthin (+AST) and stained with JC-1 dye and visualized with a confocal laser scanning microscope. (D) Relative ratios of red and green fluorescence densities of uninfected AGS cells (None), H. pylori-infected AGS cells (Control; * p < 0.05 vs. None) and H. pylori infection plus treatment of 5 μM astaxanthin (+AST; + p < 0.05 vs. Control). (E) Relative intracellular ATP levels measured for uninfected and infected AGS cells. See (A) for key to figure labels.

