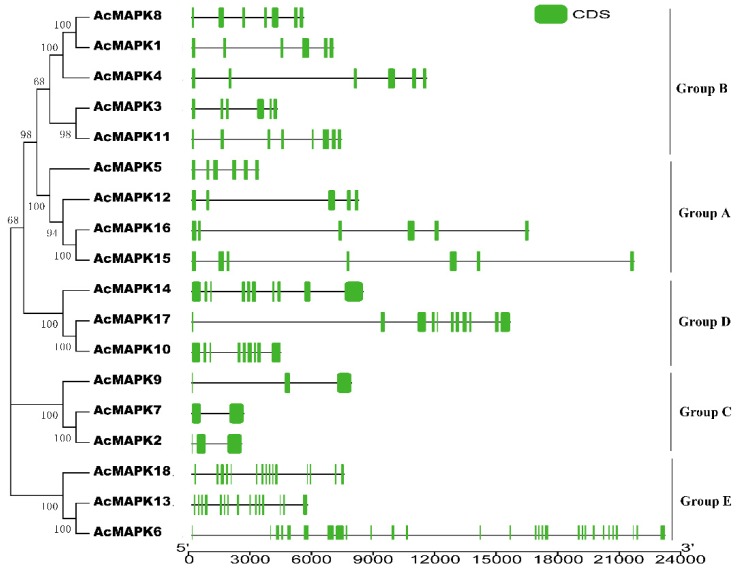
Figure 2.
The phylogenetic analysis and intron/exon structures of putative MAPK genes in A. chinensis. The phylogenetic tree (left panel) was created using MEGA5.0 program with the neighbor-joining (NJ) method. Exon/intron structures of the MAPK genes are shown in the right panel. The green boxes indicate the exons, whereas the single lines indicate introns. Gene models were drawn to scale as indicated on bottom.

