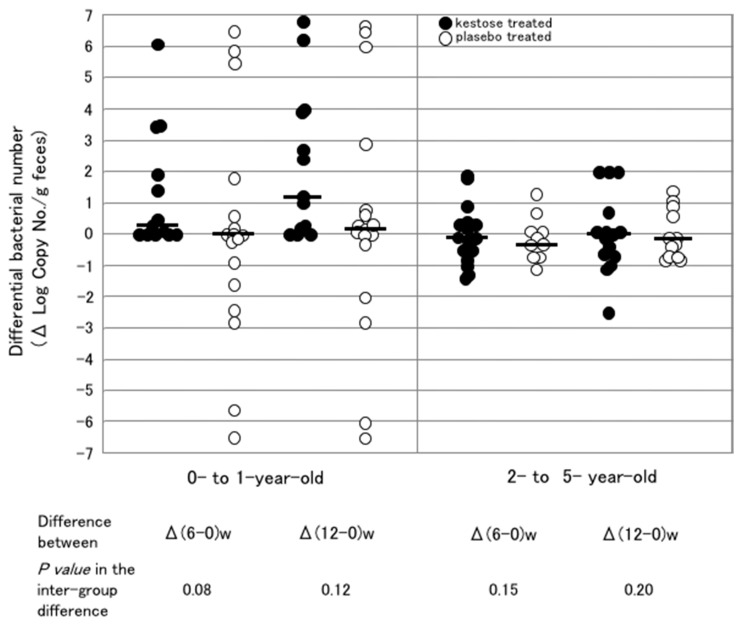
Figure 4.
Changes in the number of F. prausnitzii after the treatment in the subgroups of younger and older infants. The left and right subpanels show the subgroups composed of subjects at 0 to 1 year of age and 2 to 5 years of age, respectively. Each symbol represents the differential change in the number of bacteria in subjects at 6 and 12 weeks after the start of the treatment. Filled and open circles indicate the subjects treated with 1-kestose and placebo, respectively. Bars represent the median of the differential bacterial numbers. (Unpublished figure).

