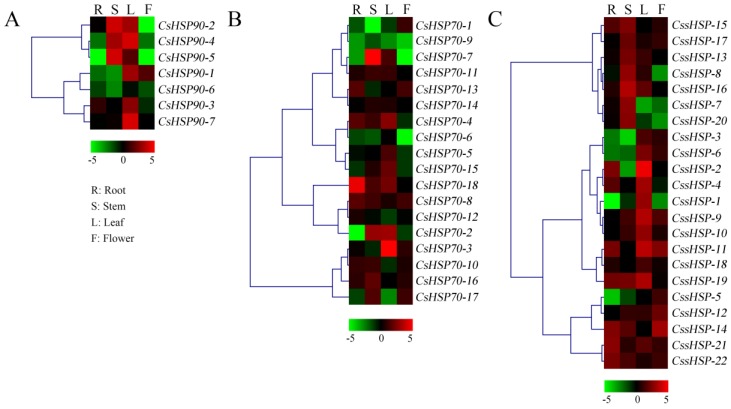
Figure 6.
Expression patterns of CsHSP90 (A), CsHSP70 (B), and CssHSP (C) genes in different tissues of tea plant. R indicates root; S, stem; L, leaf; F, flower. The heatmap was generated by MeV software (TIGR, Rockville, MD, USA) using the CsHSP genes’ expression data, and normalized log2 transformed values were used with hierarchical clustering. The red and green colors indicate higher or lower transcript abundances than those of the relevant control, respectively.

