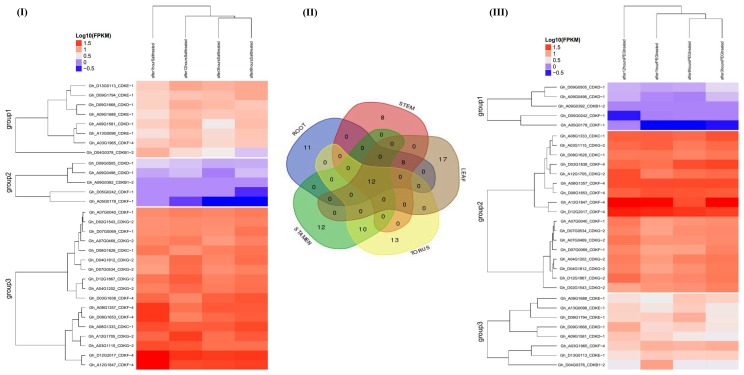
Figure 4.
RNA sequence profiling of the CDK gene expression under salt and drought stress. (I) Heat map displaying expression changes of differentially expressed CDK genes in upland cotton, G. hirsutum plants stressed for 1 h, 3 h, 6 h, and 12 h of salt stress compared with the control; (II) Venn diagram depicting the expression of the CDK genes in various tissues and (III): Heat map displaying expression changes of differentially expressed CDK genes in upland cotton, G. hirsutum plant stressed for 1 h, 3 h, 6 h and 12 h of drought compared with the control.

