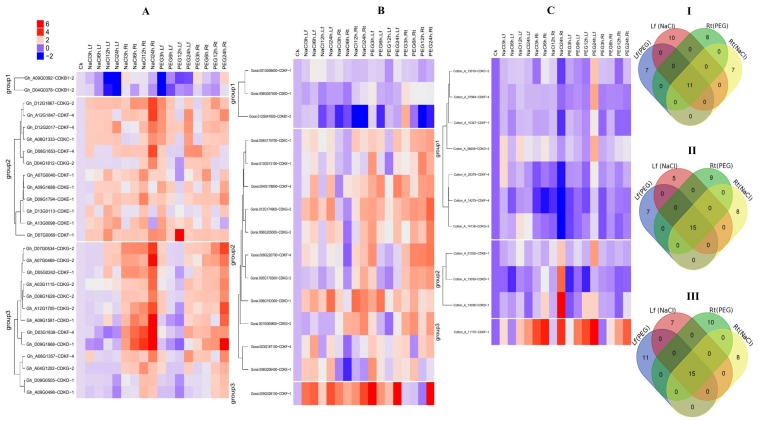
Figure 5.
Transcriptome profiling of CDK gene expression through RT-qPCR under salt and drought stress. (A–C) Heat map displaying expression changes of differentially expressed CDK genes in G. hirsutum, G. raimondii, and G. arboreum respectively plants stressed for 3 h, 6 h, 12 h and 24 h of salt and drought stress compared with the control; (I, II and III) Venn diagram depicting the number of up regulated CDK genes in root and leaf tissues at 24 h of drought (PEG) and salt (NaCl) stress exposure.

