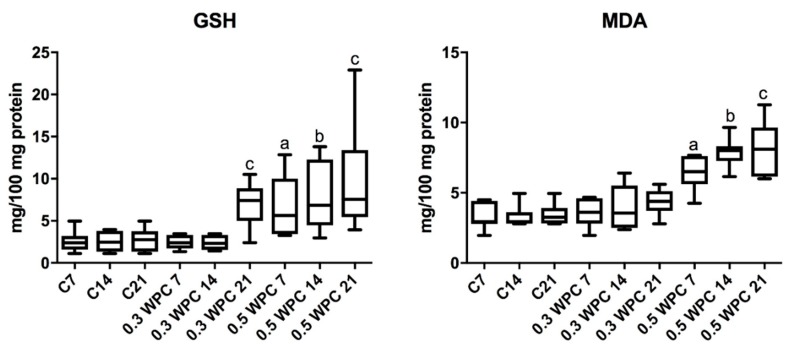
Figure 5.
Reduced glutathione (GSH) and malondialdehyde (MDA) concentrations in the liver of WPC-80-fed rats and the control group. C7, C14, C21, control groups; 0.3 WPC 7, 0.3 WPC 14, 0.3 WPC 21, 0.5 WPC 7, 0.5 WPC 14, 0.5 WPC 21, experimental groups. Differences statistically important: a vs C7; b vs C14; c vs C21 (p < 0.05).

