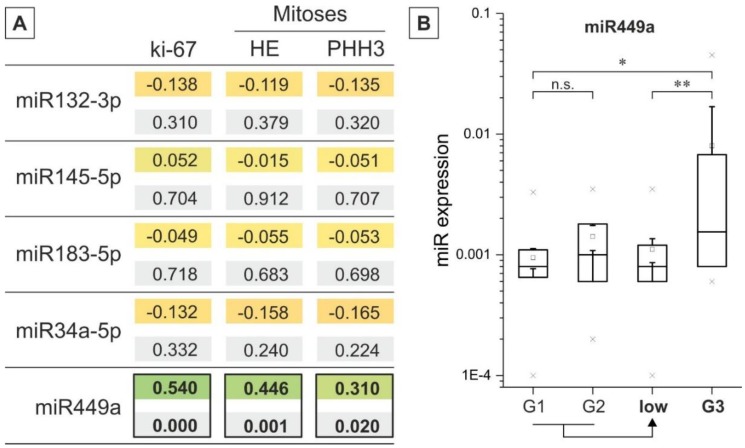
Figure 2.
(A) Correlation analysis microRNAs (miRNA) expression and markers of proliferation and mitosis. The upper value stands for the Pearson correlation coefficient (absolute values), and the lower value is the related p value; significant differences are highlighted (black rectangles); (B) Quantitative analysis of pNET-miRNA expression versus grading. miRNA expression is plotted via box plots versus grading of pNET cases. Additionally, the expression levels were summarized for G1 and G2 pNET cases. * p < 0.05, ** p < 0.01 (t-Test and ANOVA).

