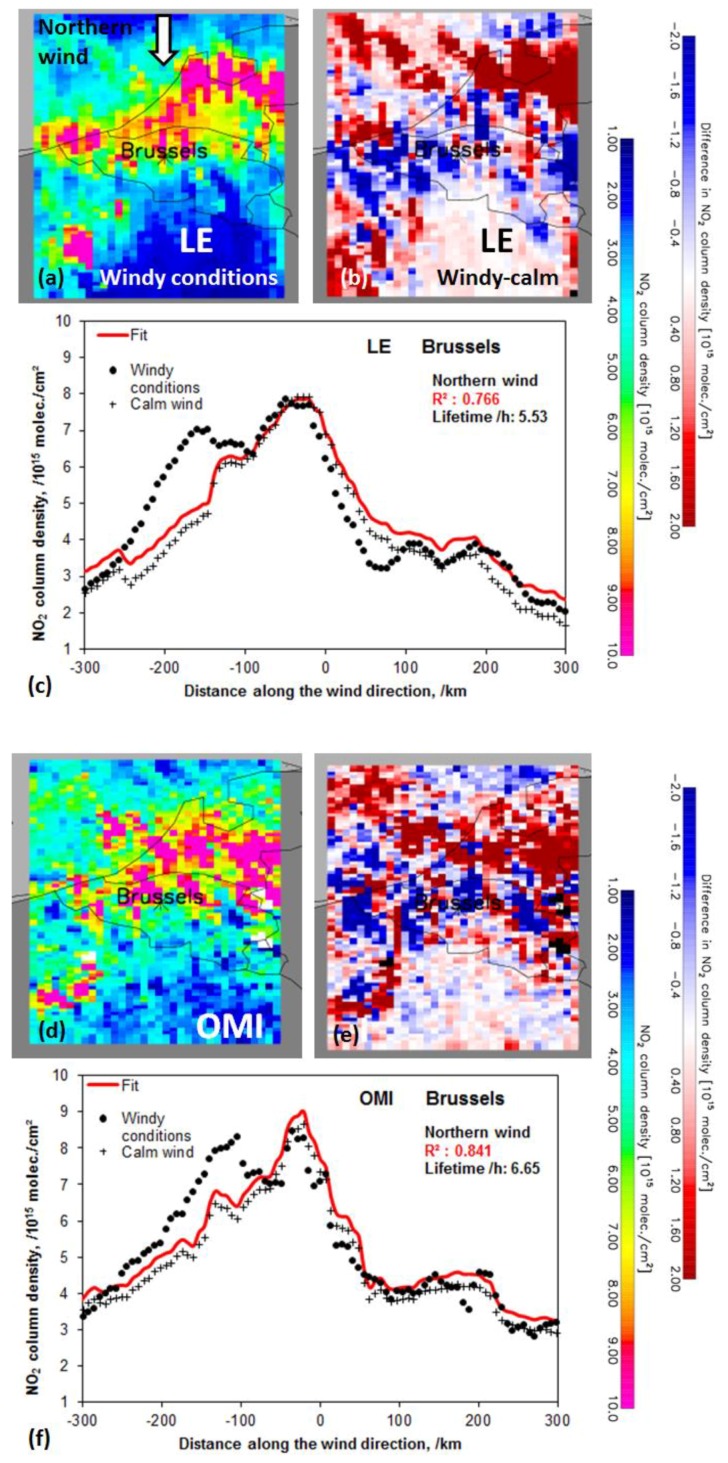
Figure 1.
Spatially explicit LOTOS-EUROS (Long Term Ozone Simulation-European Ozone Simulation) (a) and Ozone Monitoring Instrument (OMI) (d) tropospheric NO2 columns for winds coming from the north centred around Brussels according to the major up & down-wind distance of ~300 km and an across wind direction distance of ~100 km sampled on available OMI data on a 0.125° × 0.125° grid for windy conditions (>5 m s−1) averaged over the period April–September 2013. The difference map between windy and calm conditions for LOTOS-EUROS (b) and OMI (e). The averaged tropospheric NO2 columns of Brussels converted to upwind and downwind line densities LOTOS-EUROS (c) and OMI data (f) for both calm as windy conditions. The fit of the exponential function under windy conditions and the observed NO2 pattern under calm conditions are convolved using Equations (2a) and (2b) and is given in red. The corresponding effective lifetime and R2 values of the fit are also shown.

