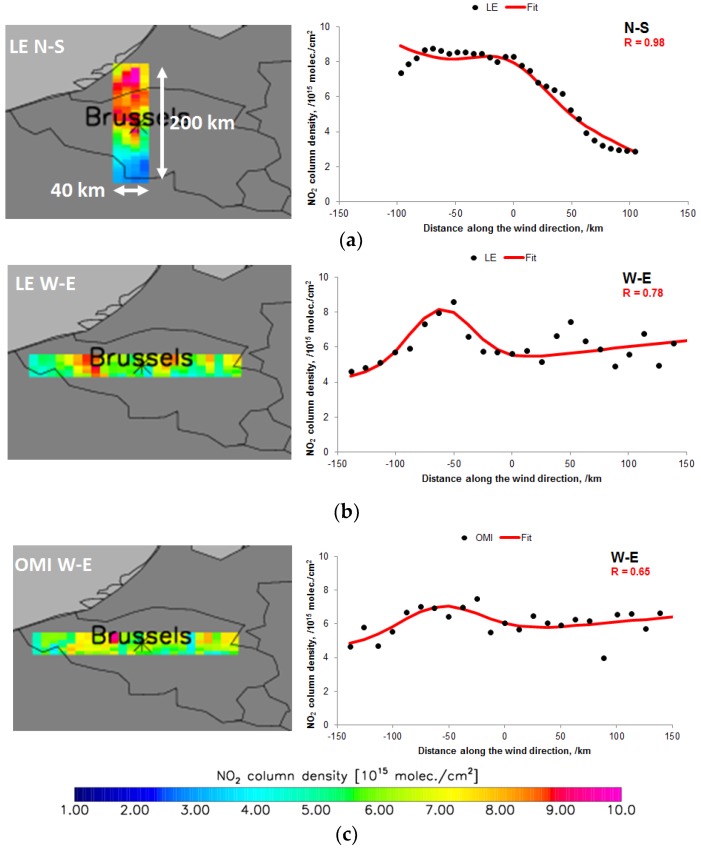
Figure 2.
The averaged tropospheric NO2 columns of Brussels for the period April–September 2013 for calm wind conditions for LOTOS-EUROS data (LE) and OMI data. The maps on the left show the NO2 patterns for their specific wind directions using a 200 km range along and 40 km across the wind direction as indicated. The graphs on the right show the corresponding line densities with Equation (4) fit on the data. (a) shows the LE NO2 patterns and line densities for N-S winds, (b) shows the LE NO2 patterns and line densities for W-E winds, (c) shows the OMI NO2 patterns and line densities is for N-S winds.

