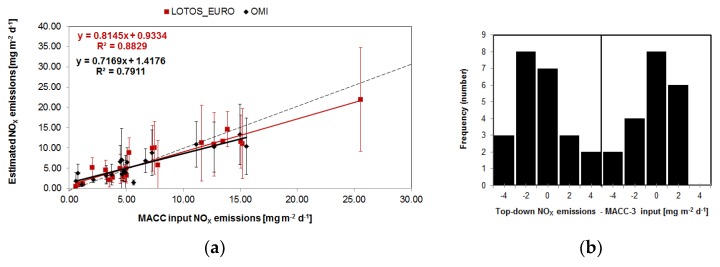
Figure 3.
Top-down derived NOX emissions estimated from the tropospheric NO2 line densities for different European cities against the MACC-III emissions as used in LOTOS-EUROS (a). NOX emissions from LOTOS-EUROS versus MACC-III in red. OMI based versus MACC-III in black. For each NO2 data set the statistics (slope, intercept, correlation coefficient) are provided. The OMI derived emission of 4.28 ± 1.68 mg m−2 day−1 for St.-Petersburg is omitted from the figure. (b) The distribution of the difference of the top-down and MACC-3 input emissions.

