Figure 5.
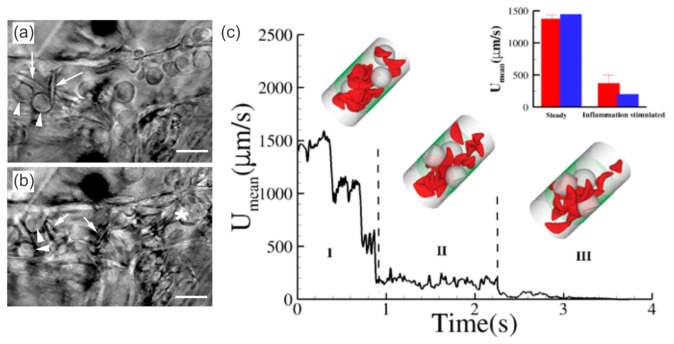
Still frames of intravital microscopy showing (a) interactions between SS-RBCs (arrows) and adherent leukocytes (arrow-heads) in the venules of sickle mice and subsequent (b) venular occlusion (white asterisk). Reproduced from reference [112]. (c) In silico studies of vessel occlusion induced by inflammation-stimulated leukocytes. Instantaneous mean velocity of the blood flow in a vessel of diameter of D = 20.4 m and Hct = 13% encompassing three leukocytes. (Insets) The green dotted region represents the coated ligands, mimicking the inflammation region of the vessel. Snapshots represent blood flow states as follows: (I) initial stage of inflammatory response and free motion of the blood flow; (II) moderate RBC-leukocyte interactions and blood flow slowdown; (III) late stage of the inflammatory response, where the RBC-leukocyte interaction is further intensified, leading to entrapment of multiple SS-RBCs on the adherent leukocytes and consequent vessel occlusion. (Inset plot) Side-by-side comparison of experiments versus simulations. The blue bars represent the blood flow velocity of the present study and the red bars represent the experimental results in reference [100], where measurements were taken on 23–41 venules with average diameters of 20.9 ± 1.3 m and 24.9 ± 1.8 m before and after inflammation stimulation. Reproduced from Lei et al. [110].

