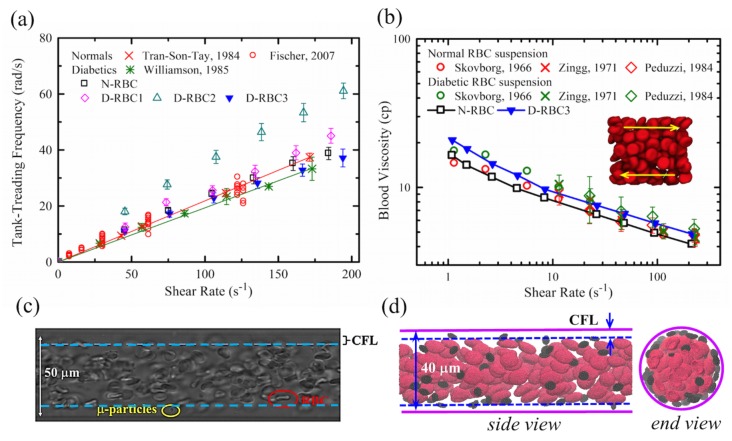
Figure 10.
(a) Normal and T2DM RBC tank-treading frequency as a function of the shear rate. Simulation results [152] compared with experimental data by Fischer (red circle) [156], by Tran-Son-Tay et al. (red cross) [158], and Williamson et al. (green star) [155]. Linear fits for the experimental data of normal RBCs (red line) and diabetic RBCs (green line). Reproduced from reference [152] with permission. (b) Blood viscosity of normal and T2DM RBC suspension as a function of shear rate at a hematocrit of 45%. Simulation results (squares and triangles) [152] compared with experimental data (circles [144], crosses [161], and diamonds [162]). The red and green symbols are for the normal and diabetic RBC suspensions, respectively. Reproduced from reference [152] with permission. (c) Typical particle/platelet margination observed in blood flow from an in vitro study [163]. Reproduced from reference[163] with permission. (d) A DPD simulation of RBCs and platelets flowing in a circular channel showing an apparent cell-free layer (CFL).

