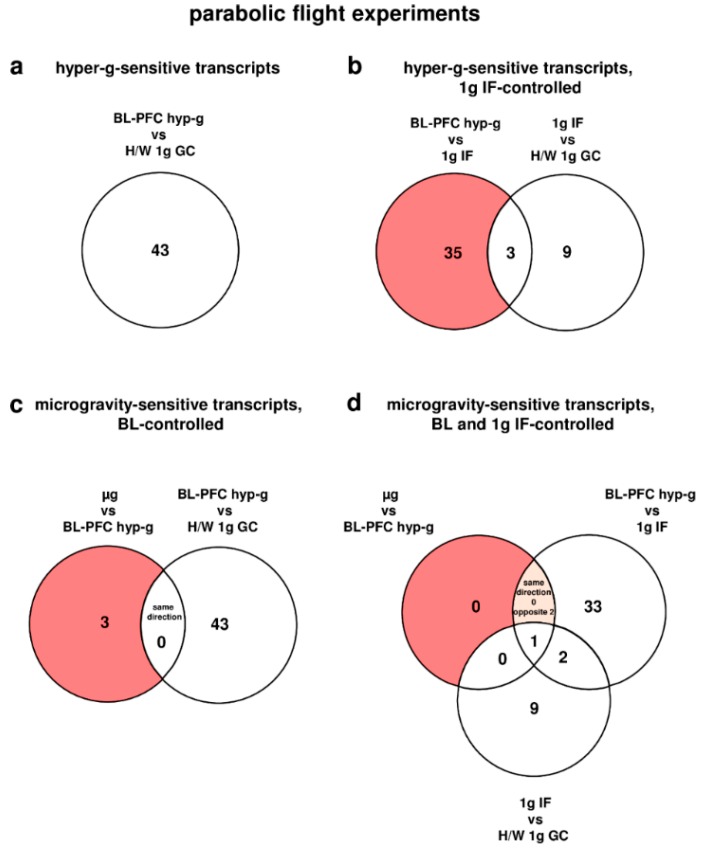
Figure 1.
Differentially regulated transcripts (list of genes in Supplementary Table S6) of the oxidative stress response in human U937 myelomonocytic cells during the 19th DLR parabolic flight campaign. The different comparisons and resulting intersections for hypergravity and microgravity-sensitive transcripts are displayed as venn-diagramms. In the circles numbers of transcripts are given that are differentially expressed according to fold changes ≤ −1.3 or ≥ +1.3, p < 0.05 in the respective comparison. (a) Number of hyper-g sensitive transcripts. (b) The red area shows the number of 1g IF-controlled hyper-g-sensitive transcripts: differentially expressed in the comparison BL-PFC hyp-g versus 1g IF excluding those differentially expressed in the control comparison 1g IF versus H/W 1g GC. (c) The red area shows the number of BL-controlled microgravity-sensitive transcripts: differentially expressed in the comparison µg versus BL-PFC hyp-g excluding those differentially expressed in the control comparison BL-PFC hyp-g versus H/W 1g GC. (d) The red area shows the number of 1g IF- and BL-controlled microgravity-sensitive transcripts: differentially expressed in the comparison µg versus BL-PFC hyp-g excluding those differentially expressed in the control comparisons BL-PFC hyp-g versus 1g IF and 1g IF versus H/W 1g GC. For the abbreviations of the experiment group names see Table 1.

