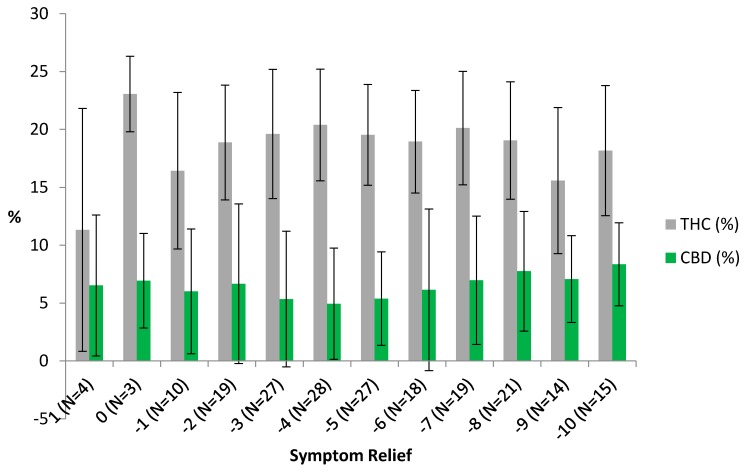
Figure 1.
THC and CBD Levels by Symptom Relief Experienced. Symptom relief is measured as ending symptom level minus starting symptom level with −10 the maximum level of symptom relief. Error bars show the range of values within one standard deviation of the mean. No users who reported THC and CBD percentages reported symptom levels worsening by more than one unit. The number of sessions for each level of symptom relief is reported in parentheses with the sample restricted to those users reporting both CBD and THC potency levels, which range between 0% and 30% and 2% and 35%, respectively.

