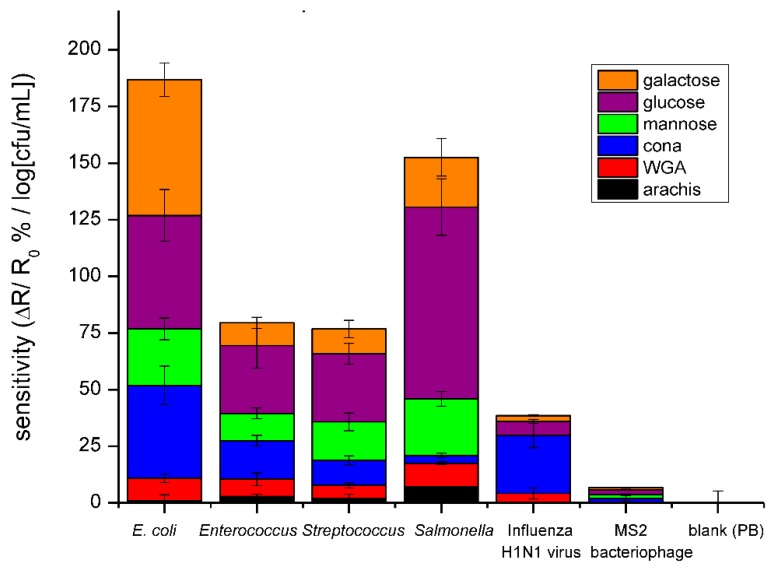
Figure 6.
Bar graph comparing the average sensitivities for detection of E. coli, Enterococcus faecalis, Enterococcus mutans, Salmonella, H1N1 Influenza virus, and M13 bacteriophage in PB using the three lectins and saccharides. The data points are average measurements from 10 independent biosensors, and the error bars represent ±1 standard deviation.

