Figure 2.
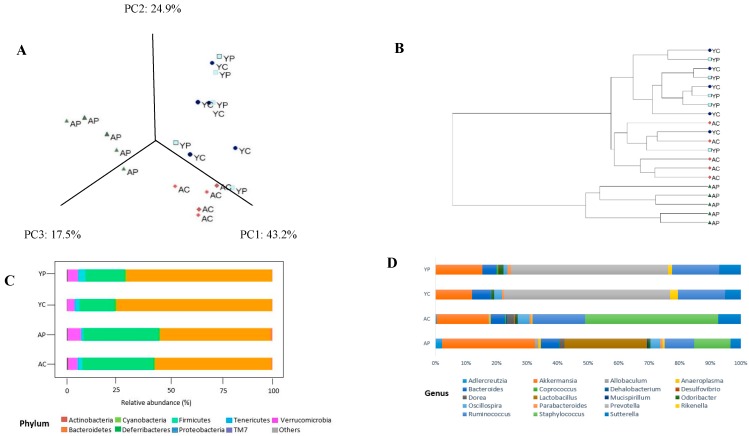
The gut microbiota changes observed in young control group (YC), young probiotic group (YP), aging control group (AC), aging probiotic group (AP) differentiated by principal coordinate analysis (PCoA) (A) and UPMGA dendrogram (B). The gut microbiota composition profiles at phylum (C) and genus levels (D) in control and probiotic-treated group, revealed by 16S rRNA gene sequencing (each color represents bacterial phylum and/or genus).

