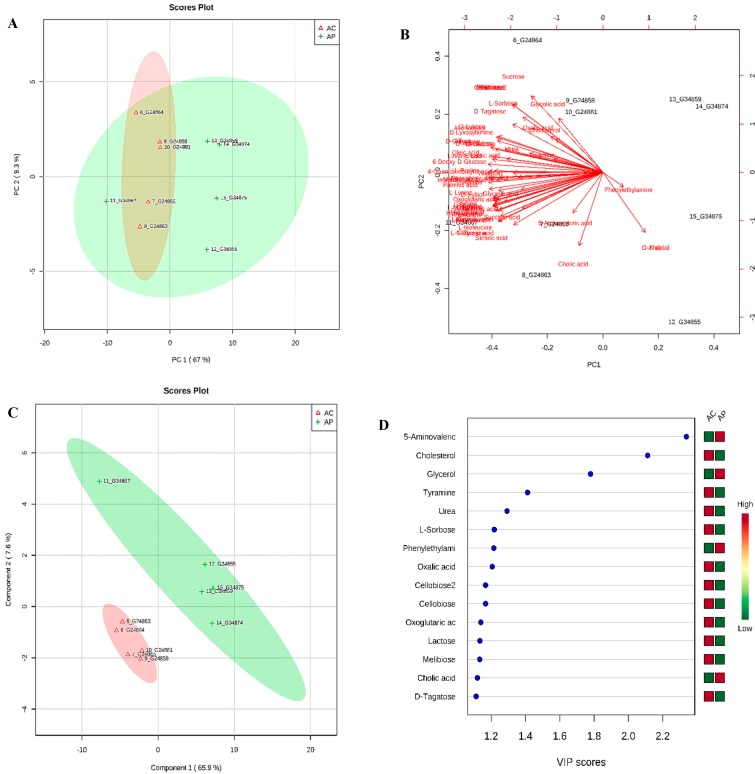
Figure 6.
(A) PCA plot of feces collected from aging control (AC, red color) and aging probiotic groups (AP, green color) showing divergence. (B) Bi-plot showing compounds responsible for divergence (C) 2D-PLS-DA plot showing spatial division among groups (D) Key compounds separating AC and AP based on variable importance in projection (VIP) score plot in PLS-DA analysis.

