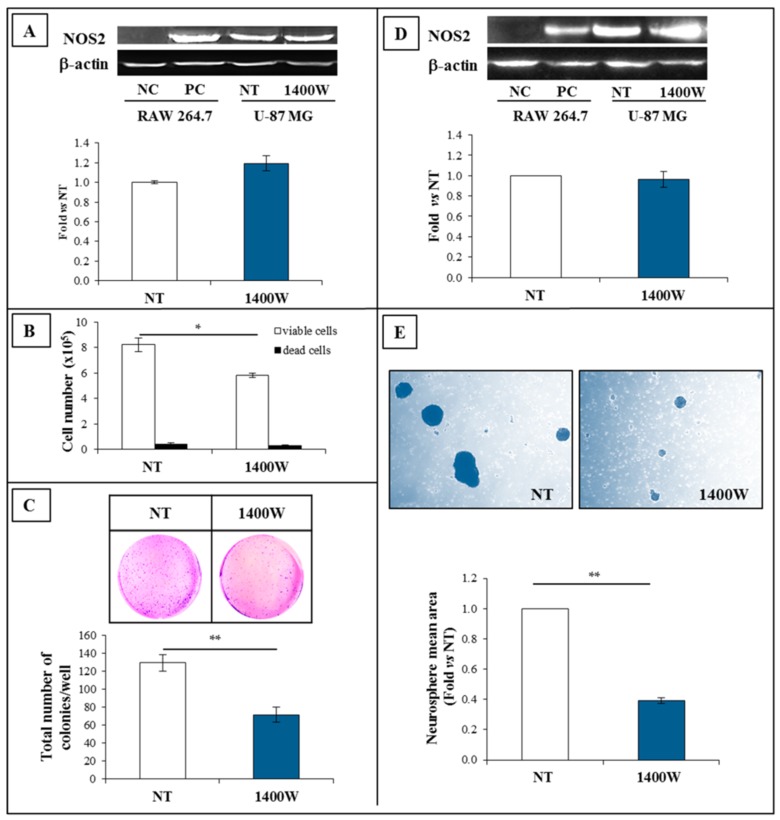
Figure 9.
NOS2 expression in human glioblastoma primary cultures. (A) Representative Western blot of NOS2 and β-actin in GBM adherent glioma primary cells cultured in standard condition for 24 h. NC (negative control): Untreated RAW 264.7; PC (positive control): RAW 264.7 treated with LPS (1 µg/mL) and IFN-γ (100 ng/mL) for 24 h. Results of quantification analysis of blots by densitometry expressed as fold vs. NT are reported in the histogram. The results from two independent experiments in duplicate are presented as mean ± SEM. (B) Effect of NOS2 inhibitor, 1400W (100 µM) on GBM adherent glioma primary culture cell number (viable and dead cells) after 24 h of culture. The results from two independent experiments in duplicate are presented as mean ± SEM. For comparison between two means, Student’s unpaired t-test was used (* p < 0.05). (C) Representative microscopic images of the clonogenic assay of human adherent GBM primary culture not treated (NT) or treated daily with NOS2 activity inhibitor 1400W (100 µM) for 20 days. Quantitative results of clonogenic assay are reported in the histogram and expressed as the total number of surviving colonies/well. Data represent the mean ± SEM of two independent experiments in duplicate. For comparison between two means, Student’s unpaired t-test was used (** p < 0.01). (D) Representative Western blot of NOS2 and β-actin in primary culture-generated neurospheres not treated (NT) or treated with 1400W (100 µM), which was daily added to the culture for 20 days. NC (negative control): Untreated RAW 264.7; PC (positive control): RAW 264.7 treated with LPS (1 µg/mL) and IFN-γ (100 ng/mL) for 24 h. Results of quantification analysis of blots by densitometry, expressed as fold vs. NT are reported in the histogram. The results from three independent experiments are presented as mean ± SEM. For comparison between NT and 1400W conditions, Student’s unpaired t-test was used. (E) Representative phase contrast images (4× magnification) of human GBM primary culture maintained in GSC-M condition (GSCs) to allow neurosphere generation in the absence (not treated, NT) or presence of 1400W (100 µM), added daily for 20 days. Quantification analysis of neurosphere mean area reported as fold vs. NT is shown in the histogram and expressed as the mean ± SEM of two independent experiments in duplicate. For comparison between two means, Student’s unpaired t-test was used (** p < 0.01).

