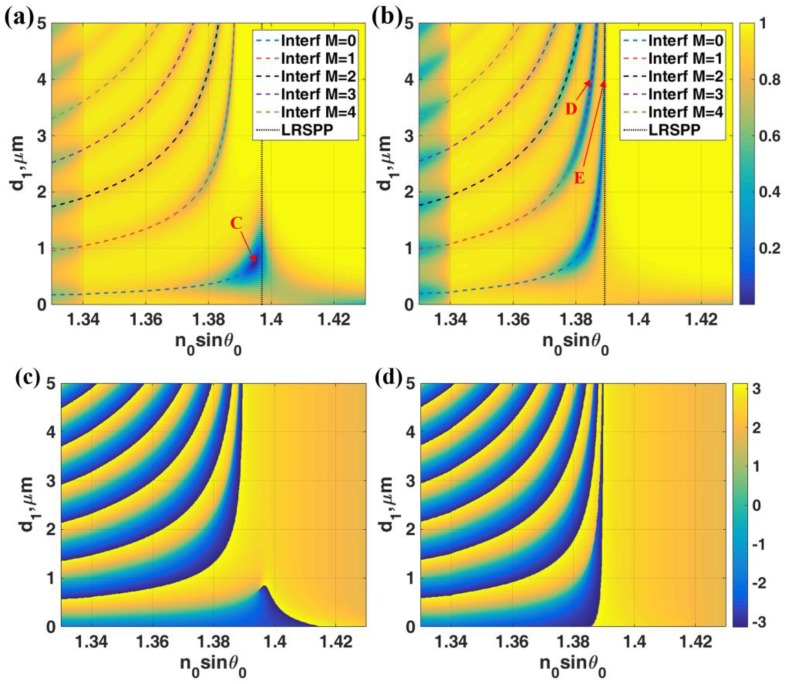
Figure 5.
Simulation results for = 633 nm, n0 = 1.52, n1 = 1.39 with thickness d1 and n2 = 0.18344 + 3.4332i with thickness d2 and n3 = 1.34. (a) |rp|2 when d2 = 30 nm and (b) |rp|2 when d2 = 20 nm (c) Phase(rp) in rad when d2 = 30 nm and (d) Phase(rp) in rad when d2 = 20 nm. The colored curves shown in (a,b) are the interferometric mode positions calculated using Equation (3) and the LRSPP mode

