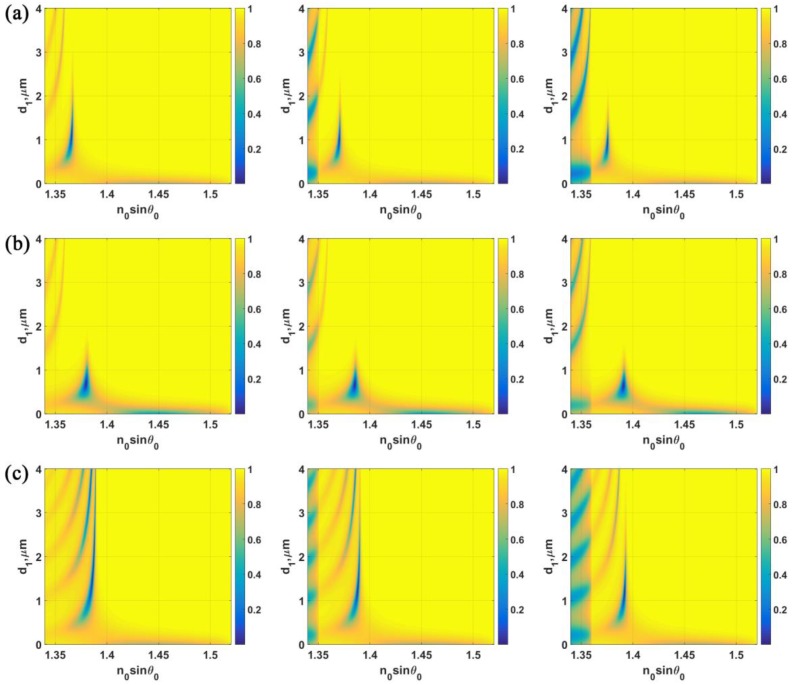
Figure 9.
|rp|2 responses for the following structure parameters. (a) n0 = 1.52, n1 = 1.3616, n2 = 0.18344 + 3.4332i with d2 = 20 nm; (b) n0 = 1.52, n1 = 1.3616, n2 = 0.18344 + 3.4332i with d2 = 30 nm; (c) n0 = 1.52, n1 = 1.39, n2 = 0.18344 + 3.4332i with d2 = 20 nm; (d) n0 = 1.52, n1 = 1.39, n2 = 0.18344 + 3.4332i with d2 = 30 nm. Each column represents responses due to different sample refractive indices, n3 = 1.34, 1.35 and 1.36 shown in left, middle and right columns, respectively.


