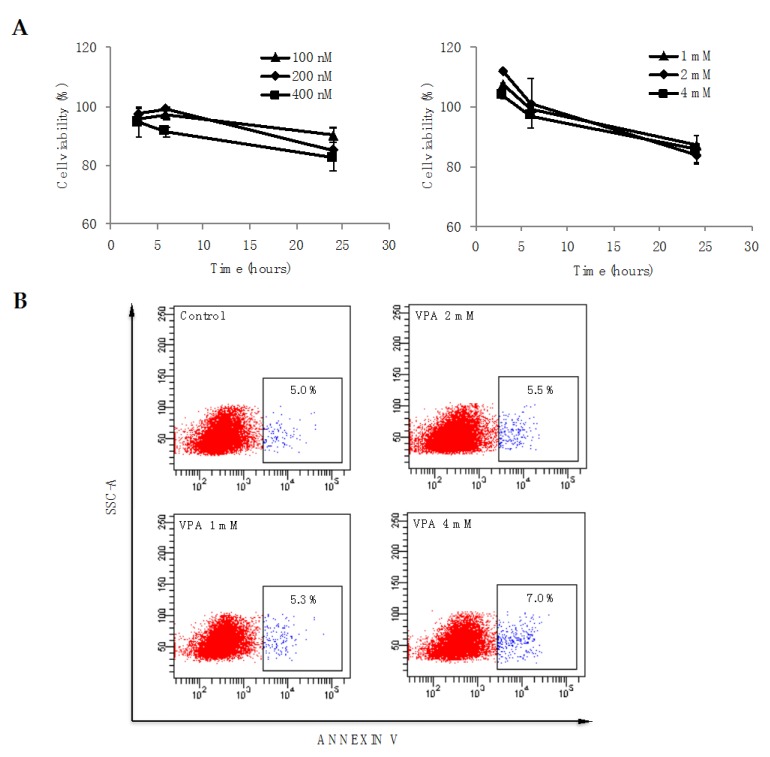
Figure 2.
Cell viability of PBMCs pre-treated with TSA and VPA. (A) PBMCs were treated with different concentrations of TSA (left panel) or VPA (right panel) and their metabolic activity was quantified after 3, 6 and 24 h using resazurin. The percentage viability was calculated as described in the methods section. Error bars represent the mean ± SEM of three independent experiments; (B) PBMCs were treated with different concentrations of VPA, and after 24 h, CD14+ cells were analyzed for apoptosis using Annexin V.

